This month we’ll break our market analysis down into our usual 4 pillars of market health: 1) The action of the indexes, 2) The action of the best leading stocks, 3) Sentiment & Psychology-based indicators, and 4) Historical precedent action. Remember that Thomas and I place the most weight on pillars 1 and 2 (our primary measures of market health) when performing our analysis. Pillars 3 and 4 are important, but are secondary indicators in nature and need to be treated as such.
After July’s strong upward move, we’ve updated much of our analysis and will present that information in the coming sections. The market has reached historic levels and we’re starting to see accompanying froth on the current move. While we feel August/September could bring a short selloff, the market will likely continue higher through the end of 2013. The action of leading stocks has been nothing short of extraordinary. Facebook’s move has reestablished it as a leading stock and we’ll discuss its recent action below.
I’m going to dive right into analysis under the assumption that readers of this commentary have read our previous installments and have developed a basic understanding of our approach to the market. For first time readers, I recommend reviewing our February 2013 Commentary and earlier to ascertain a detailed explanation of why we at Satellite Capital examine what we do, and why we are interested in certain stocks over others. And as always, please don’t hesitate to contact Thomas or myself with any questions.
Indexes
For the month of July, the Nasdaq rocketed 6.6% higher while the S&P500 jumped 4.9%. The Nasdaq closed July at 3649, its highest level since October 2000. Despite ending the month at bull market highs, both the Nasdaq and S&P500 finished the month with a tally of 5 days of professional selling (a measurement discussed in prior months). This demonstrates to us there is a high volume of stock available for sale at current levels. Economics tells us that when supply is greater than demand, price has to drop to match the quantity offered with the price that participants are willing to pay. If further supply comes onto the market, prices could drop rapidly.
Just because the current tally of selling days is elevated doesn’t mean the market will turn south tomorrow. Counting days when supply outweighs demand is just one way to interpret market action. We also have to look at the action of the best leading growth stocks in the market, which we’ll address in the next section. Taken with other indicators, the indexes appear to be ready for a drop. And of special note are the emerging divergences indicating that such a move to the downside could be coming.
For example, in August 2010 the Nasdaq had a 14-day period in which it fell 9.0% (8/9/10 through 8/27/10). Starting in July 2010, the index rallied off its lows and powered sharply higher (+12.0% from7/1/10 through 8/9/10). During the last 2 weeks of its move up, the index accumulated a handful of selling days (5 to be exact, the same as we have now) before plunging sharply for 3 weeks. For comparison’s sake, from the June 24th low through the close on 8/2/13, the Nasdaq has climbed 11.9% and we’ve picked up the 5 days of selling over a similar time period.
Last month I opined that the May-June selloff was the start of a broader Down 4 Elliott wave. But as the market moved to new highs in early July, it became clear this interpretation was wrong. And when you are wrong, the only thing to do is change your opinion as facts change. The ability to remain fluid with intepretations is a key distinguishing factor between average and exceptional investors. More on our updated analysis in the History & Precedent section below.
In summary, the indexes are currently in a highly distributive state despite notching new bull market highs. Given the divergences we are seeing (check the Sentiment & Psychology section below) and the massive run the indexes have had from their June 24th lows, a short pullback could be healthy for stocks. If new selling begins to hit in coming days, an investor would be wise to cull any positions without a sufficient cushion to weather a quick pullback. Remember, one can always reenter a position once any downward pressure on the market abates.
Leading Stocks
The best fundamentally sound stocks had an amazing month of July. To start, I want to bring back an old maxim that “the market will either wear you out or scare you out.” We were 100% correct in our analysis that Facebook (Nasdaq: FB) was going to be a big leader. But true to the maxim, we were shaken out of both our conviction and our position right as the stock hit bottom. On July 25th after its earnings release the night before, Facebook rocketed 29.6% on volume that was 749% above average (over $10B of FB stock traded hands on this one day alone). Earnings for the quarter were up 58% versus last year and sales accelerated to 53% greater than last year in a clear demonstration that FB figured out how to monetize its mobile platform.
This impressive move firmly landed Facebook back on our watch list as a stock to own in coming months (possibly years). We see the possibility Facebook could even become the true market leading stock (a designation previously held by Apple). Overall, FB closed the month of July up an astounding 47.9%.
At this point, you may ask yourself why we’d be interested in a stock that just made a huge move like this. Haven’t we already missed our chance at the gains associated with this stock? The short answer: probabilities suggest this stock has about a 2 year period in which it could absolutely dominate. The returns it generated in July demonstrate the stock is now in favor (in a big way) with premier institutional investors. Research Thomas and I performed on hot tech IPOs suggests that after demonstrating their leadership by rising sharply from typical early selloffs (remember FB fell 60% from its IPO high of $45 to just below $18), the stocks often move near all-time highs ($45 for FB) and then begin a consolidation phase before eventually rocketing higher.
The time to own the stock is when it exits this consolidation and begins to power higher (in Facebook’s case, you want to be on board when the stock climbs above $45, possibly a little earlier depending upon the pattern that emerges). There is no hot tech IPO in recent history that climbed straight through its IPO high without building a price consolidation near that level. For recent examples, look at charts of LNKD and QIHU, 2 of our big gainers. You could also go back to BIDU in early 2007 and even YHOO in 1997 to see the type of action we’re describing.
The core crop of leaders we’ve been following exhibited outstanding performance in July 2013: CELG +25.5%, LNKD +14.3%, QIHU +40.9%, and TSLA +25.1%. When leading stocks generate gains like this, it’s easy to see that we’re in a raging bull market. The best merchandise will always lead the market higher in up phases and lead it lower in down phases.
Overall, the best leaders have already broken out of their patterns at this point and are notably extended. Entering positions at these levels without any sort of price consolidation is an extremely risky proposition. We recommend being patient and waiting for a more prudent entry into these stocks with a higher probability for upside movement. Given what we are observing regarding market action, some of these leaders could consolidate in August and possibly into September, thereby offering proper entry points to those of you not already on board. Big gains appear to be in the cards for the end of the year. Keep your powder dry and be ready to pounce when opportunity presents itself.
Sentiment & Psychology
This month, I’ll discuss 3 secondary indicators I watch very closely that often hint at coming changes in market direction. By themselves, these indicators don’t give a full picture as to what’s happening. The beauty of these indicators is when you couple them with market action and look for divergences. Any divergence is significant and must be noted.
First, an indicator I discuss almost every month, the NYSE Advance/Decline line, had been making great progress through May 2013. This indicator then fell by 17%, while the S&P500 only fell by 7.5% during the corresponding month-long selloff from May through late June. That in itself is significant, but the rebound starting on June 24th through the end of July has now pushed all of the indexes into new bull market high ground. Meanwhile, the A/D line has yet to make a new high, thereby creating a divergence and demonstrating the market is weaker than it appears. To us, this indicates the market breadth is less strong than it was leading up to its May 2013 peak.
Second, it’s worthwhile to monitor the raw number of new highs and lows on a given day (I look at measures of both the NYSE and Nasdaq). When the indexes are making new highs, it’s optimal to see the number of stocks also making new highs be at its peak. When the market moves to new high ground but the intensity of new stocks also hitting new highs is not at its strongest, we have another divergence. That is indeed the case as of July’s close. Market internals are weakening before our eyes.
Lastly, looking at the percentage of stocks above key moving averages (usually 20/50/200 day MA’s) yields an interesting observation. 70% of the stocks on the Nasdaq are currently above their 200-day moving average, which is quite frothy considering the last time the index reached this level was in January 2004 (just prior to entering a 7-month correction). Both the percentages of stocks above their 20-day and 50-day MA’s had been at extreme levels for some time, but have recently come off those peaks while the market has continued to chug to new highs. This is a divergence and is significant. This divergence tells us that while a few stocks are pushing the market higher, many more are actually weakening and selling off. Such action is characteristic before a correction of any magnitude.
One final reminder is that sentiment and psychology-based indicators are secondary in nature. The most important action is by far that of the indexes and leading stocks. Both Sentiment & Psychology and History & Precedent can help us work towards a deeper level of understanding of a given market environment, but we need to cement in our minds that they are of secondary importance. Probabilities suggest that the market could begin to roll over in August (and it could be a short drop), but we need to remember that markets can remain in their trends longer than we hope or want them to. As economist John Maynard Keynes quipped: “Markets can remain irrational a lot longer than you and I can remain solvent.” Patience is vital to correctly time commitments.
History & Precedent
In prior months we explored Elliott wave analysis, which is a practice to interpret the waves/rhythm of the market. When measured and applied properly, Elliott wave analysis holds 100% of the time (since the Industrial Revolution, i.e. the first period in which volume was significant enough to offer an accurate depiction of price history through charting). The difficulty lies in interpreting how the current waves are behaving, definitely an art and not a science. This month, I’ll demonstrate two key points related to wave analysis: 1) Wave 3 must always be the longest wave, and 2) How to break waves into smaller wave patterns. We’ll discuss these items in relation to how they influence our interpretation of what’s happening in the market today and where anticipating it may move in the coming months.
As always, History & Precedent is a secondary indicator and we use it to simply guide our thinking as to what may transpire in the marketplace. The charts and discussion that follow are merely our attempt to convey similarities that we’re seeing between very different historical time periods. I encourage you to read our other write-ups on the 1974-1980 precedent in our April 2013, March 2013, January 2013, December 2012, October 2012, and September 2012 monthly commentaries.
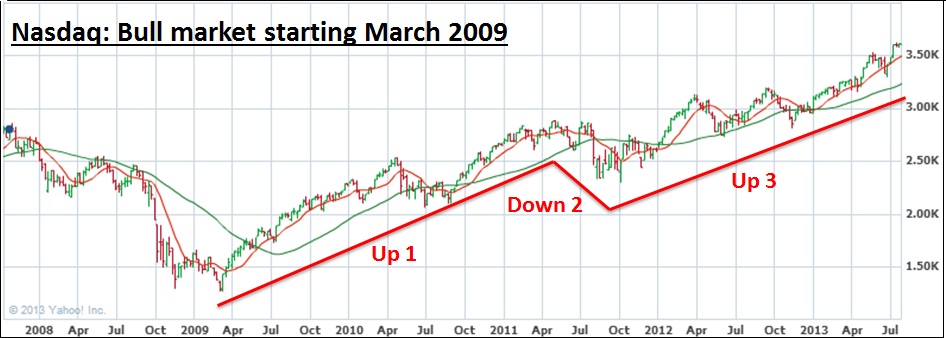
Starting with key point #1, I’m bringing back two charts I produced last month from the 1974-1980 bull market and the current bull market that started in 2009 (see below). From these charts, I want you to focus on the waves marked Up 1, Down 2, and Up 3. Then please examine the table that follows.

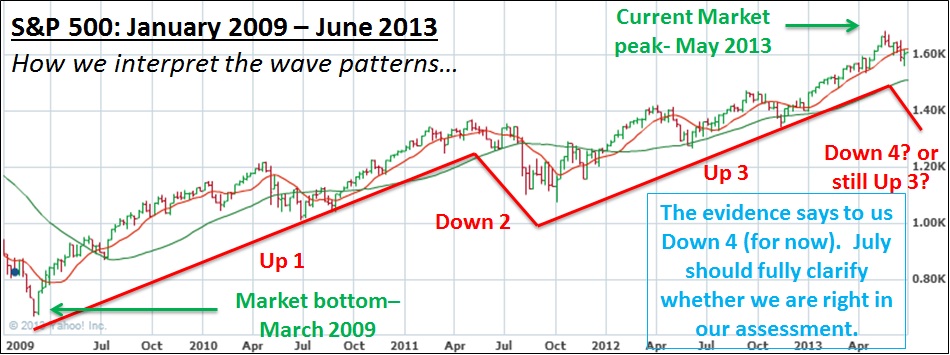
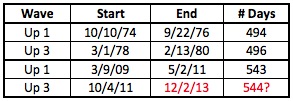
What I want you to take from this example is that Wave Up 3 is always longer in duration than Wave Up 1 (this is true of every bull market in history, not just the precedent being used here). For the precedent bull market above, it worked out that Up 3 from 1978-80 lasted just 2 days longer than the preceding Up 1 pattern.
Applying the same logic to the current bull market, the period we are considering our Up 1 (see 2009 bull market chart above) lasted for 543 trading days (which excludes weekends and holidays, i.e. this count is based only on actual days when the market was open for business). Keeping in mind that Up 3 has to be longer than Up 1, if we add 544 days (the minimum number of days the current Up 3 will last), we wind up with 12/2/2013 (again, this date has weekends & holidays removed to get a pure comparison of actual trading days). This date is simply the earliest day that the current Up 3 wave can end. The more likely scenario is that we get some slippage into Q1 2014. From this analysis, we’ve got plenty of room left in this bull market Up 3 wave to capture sizable market gains through the end of 2013.
Now turning to key point #2, I’ll discuss how to dissect big wave patterns into smaller wave patterns. The 5 wave pattern can be broken down to extreme levels of granularity, which can help us time our market commitments. On each of the charts below I’ve broken what I’m calling Wave Up 3 into its smaller 5 wave components. Note how Wave Up 3 is always the longest wave (key point #1 we just examined above), regardless of how granular the waves become.
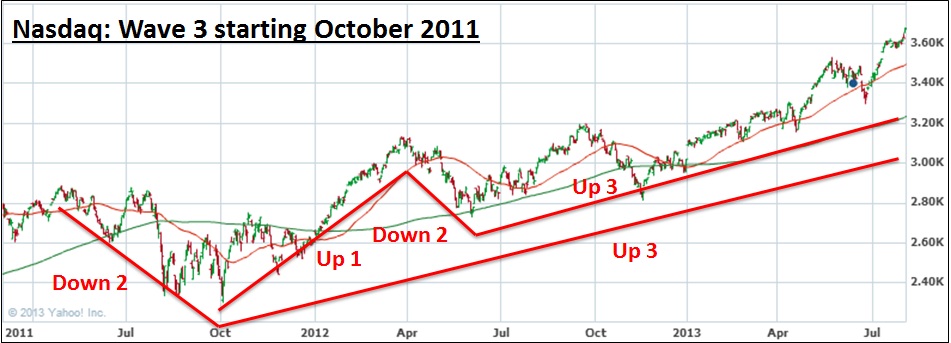
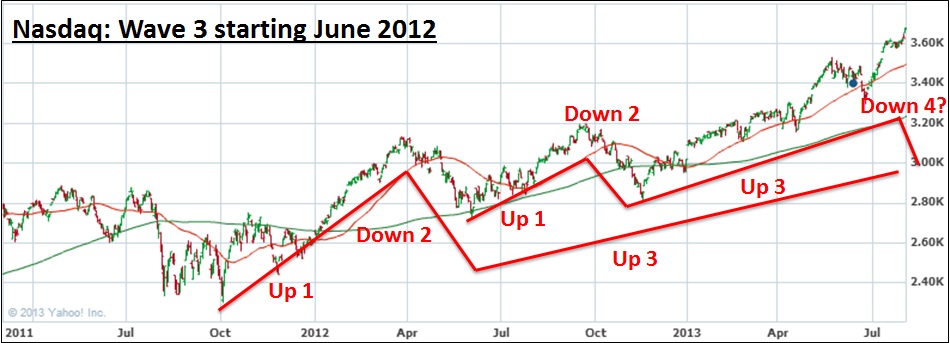
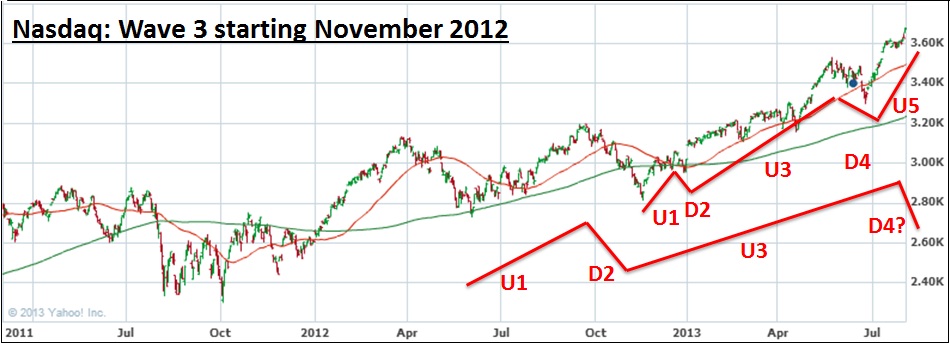
After looking at the 4 charts above, you’re likely asking yourself, “Chris, that’s great, but what does it mean?” Starting with the bottom chart, the analysis suggests we are nearing the top of an Up 3 wave (a wave that started in November 2012), which suggests we could be in store for a sharp drop starting as early as this month (August 2013!). I have this labeled by “D4?”, which I believe we will enter in August. Down 4 waves usually commence suddenly, offer little warning, and are always more powerful than the preceding D2 wave, which in our example above took place from September to November 2012. During this time, the Nasdaq fell 12.0%. If I am correct in my interpretation, the current froth in the market could be severed dramatically (meaning a greater than 12% fall in about a month).
This Down 4 wave would be part of the bigger move that started in October 2011. After a sharp Down 4, the market would climb to new highs to the top of an Up 5 wave (ending late 2013-Q1 2014). At this point, the 5 wave series that started in October 2011 would be complete. This measurement is what must line up with key point #1 discussed above (the earliest the bigger bull market Up 3 wave can top would be early December 2013).
To briefly take the analysis one step further and look at the big bull market Down 4 wave (D4 would be next on the top chart of the 4 above), we are expecting a February-March 1980/September-October 1987 style drop in Q1 2014. The move will be earthshaking and devastate both public and professional investors alike. I won’t get into the analysis here, but it will suffice to say we’re looking for the Nasdaq to fall north of 25% in about 30 trading days. While we can’t be sure what the catalyst will be (Fed chairperson change, removal of QE, China, Europe, Q4 2013 earnings reports etc), the technical nature of the analysis above strongly hints that a sabre-rattling drop is in our not too distant future.
To close this section, I can assure you that if I’ve drawn the waves correctly, which I feel I have, then the current Up 3 wave will not end before December 2013. As stated above, I’m estimating we’ll see a few months of slippage into Q1 2014 when the 5 wave pattern that started in October 2011 finally ends. When that time comes, it will be imperative that an investor exit the market completely or start to move short as portfolios far and wide will be devastated. In the meantime, after a short selloff in August/September 2013, we should see strong price gains through the end of the year and likely into January 2014. Many stocks will make strong price moves during this time and I assure you that we at Satellite Capital will be all over those leading stocks as they move to December/January peaks.
Conclusion
In summary, the market is currently very frothy and likely set for a pullback. Leading stocks have been acting extremely well and will likely outperform following any selloff that manifests. Stocks like FB, LNKD, QIHU, & TSLA appear to be best poised to burst higher through the year’s end. Unless you have a sufficient cushion to weather a correction, it would be best to wait until any selling has impacted the market and abated before tackling these high fliers. Given the combined insights from our 4 pillars above, we see big things for the market into the year’s end. Those who best position their portfolios given the factual information in front of them will surely outperform during this period.
Our style of investing necessitates the alignment of as many factors as possible to assure us that we’re entering profitable positions. All investors play a game of probabilities and those best able to analyze and judge those probabilities will dominate their competition. One last update before we cap this commentary; given new research, we’re revising our estimated 2014 bull market top to the much later date of Q1 2016. This would mean the bull market that started in March 2009 would last for approximately 7 years (definitely one for the ages). We’ll walk through some of this analysis in coming commentaries. Have a great month!