Since that October 2011 low, the housing sector has been on an absolute tear, with housing-based stocks chalking up the largest gains. The homebuilders ETF XHB (NYSE ARCA: XHB) is up 166% from its low through its May 2013 high. Leading housing stocks Pulte Group Inc (NYSE: PHM), Ryland Group (NYSE: RYL), and Lumber Liquidators (NYSE: LL) are up 643%, 430% and 577% respectively. Former leading stock from the 1980s/1990s Home Depot (NYSE: HD), now one of the world’s largest companies, is up 191% from its October 2011 low.
Despite sizeable index gains in May, most leading stocks we follow had a ho-hum performance. After significant gains from November through April, many of these leaders appear to be taking a breather before potentially continuing higher in coming months. A broad range of leadership is evident from the biotech, technology, housing, medical and leisure sectors. One notable absence to this point has been the retail sector. Some retail stocks started to perk up towards the end of May, but the sector has been a laggard over the larger 7 month rally.
May presents an excellent environment in which an investor must remain disciplined with rules and flexible with expectations. While we’ve continued to look for a potential selloff in broader markets, rising indexes have continued unabated in the absence of heavy selling. Remaining flexible with expectation enables us to capitalize on the current move, but forces discipline as we remain on the lookout for changing tides. While we’ve been referencing the period from 1974-1980 almost monthly, another precedent we’ve mentioned before appears to be much more closely related to today’s action. We’ll review this action in the History & Precedent section below.
As of the end of May 2013, a caution flag is raised due to some professional selling creeping in at month’s end. If selling persists, winding down long positions in favor of cash or light short positions would be a preferable play to weathering any potential corrections (remember, a leading stock will usually correct 1.5-2.5x the market during a selloff period). Ultimately, we need to remain disciplined with our rules and close positions that reach our loss threshold. Only positions with significant gains should be considered as candidates for a longer holding period.
I’m going to dive right into analysis under the assumption that readers of this commentary have read our previous installments and have developed a basic understanding of our approach to the market. For first time readers, I recommend reviewing our February 2013 Commentary and earlier to ascertain a detailed explanation of why we at Satellite Capital examine what we do, and why we are interested in certain stocks over others. And as always, please don’t hesitate to contact Thomas or myself with any questions.
Indexes
For the month of May, the Nasdaq rose 3.8% while the S&P500 closed the month up 2.1%. Both indexes continued their sharp ascents, with the S&P500 in new all-time high territory and the Nasdaq at its highest point since October 2000. As had been the case for the last 4 years, May was not the time to “sell and go away”. Despite fears of the U.S. Federal Reserve taking away the proverbial QE punchbowl, “slowing” growth in China, and a continuing recession in Europe, the market is clearly seeing something else as it powers higher.
Pundits argue that the $1T of cash the Fed is pumping into the economy is inflating stock prices, and that this move isn’t based purely on fundamentals with unemployment hanging around 7.5%, but they usually fail to mention that U.S. corporations are as healthy and lean as they’ve ever been, with robust balance sheets and generally positive outlooks. Corporations are largely turning to stock buybacks to return excess cash to shareholders, as somewhat limited growth opportunities persist (>$350B worth of buybacks for an average of 8% of outstanding shares has been committed by boards of directors). By historical standards, most stocks right now pretty well reflect their intrinsic valuations.
As discussed last month, the Dow Transports (DJT) has had an astounding move in 2013. The index hit an all-time high in May and appears to be now forming a head and shoulders pattern, which could indicate some downside to come. Also mentioned last month: when the DJT gets 18-ish% extended from its 200 day MA, the index typically corrects by about 15-20%. Some selling off the highs has already happened, but we’ll have to watch closer into June to see where this index goes. Railroad freight volume has been excellent, with oil and natural gas dominating railcar shipments. Airline stocks have also been faring (pun intended) well, with many airline stocks (ALK, DAL, SAVE) among the top performing transportation stocks this year.
For now, the action of the indices demonstrates a staunchly upward posture, and our portfolios need to be positioned as such. If more professional selling enters the market, an investor would be wise to lock in gains and either move to cash or take a short bias. The 3500 level on the Nasdaq and the 1700 level on the S&P500 appear to be acting as ceilings in the short-term. A strong burst through these psychologically round numbers would be positive, but as always, we let the action of the market dictate to us how we should be positioned from our top-down analysis.
Leading Stocks
Leading stocks had a mixed performance in May. The 5 stocks high on our radar going into the month performed as follows: ARMH = -6.1%, CELG = +4.7%, FB = -12.3%, LNKD = -12.8% and QIHU = +27.7%. A portfolio equally weighted in these 5 positions throughout May would have been just barely positive versus bigger gains for the respective leading indexes. Any overweighting or underweighting of the wrong security here would have led to a larger divergence with the performance of those indexes. Adding our 6th target stock discussed for the first time last month, Hertz Global Holdings (NYSE: HTZ), would have only marginally improved performance in an equally balanced portfolio (Hertz was up 7.3% during May).
May brought to the table another stock we’ve added to our target list. Remember that just because a stock makes our target list doesn’t necessarily mean we own it. There’s a right and a wrong time to initiate a position, and knowing when that time has come is key to generating market outperformance. As you are aware, we at Satellite Capital look to invest in companies with the most innovative products or services that are reshaping the landscape of global business. Along with those bigger industry trends come solid strings of earnings and sales growth, and big expectation for continued future growth. Through a combination of these solid fundamentals, we like to see technical action indicating the stock truly is under accumulation, and that others recognize the compelling story we’ve identified. One stock in May absolutely blew all of the others away in terms of price performance coupled with a game-changing story.
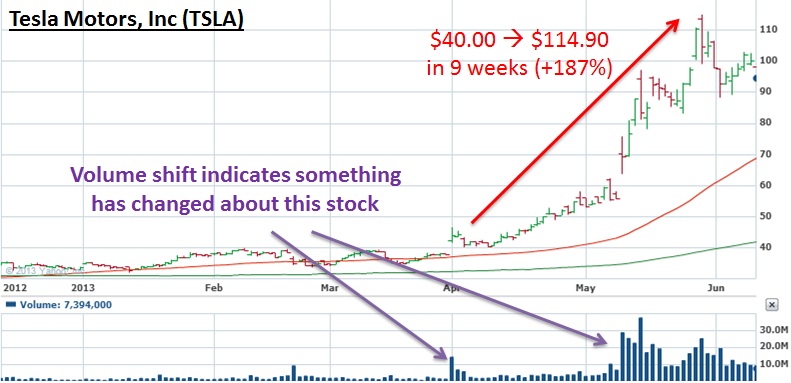
That stock is Tesla Motors (NASDAQ: TSLA). After first making our Universe Watch list in April 2013 with a 42.5% price gain, TSLA rocketed higher in May by an astounding 81.1%, for a 2-month gain of 123.6%. Not too shabby. Fundamentally, the company began selling its newest model with very positive results (adjusted earnings for the quarter were +116% above the prior year quarter and sales were +1,760% higher). Tesla is expected to turn its first ever profit in 2013 ($0.04 per share) and earn a massive gain in 2014 ($1.04 per share, or +2500% YOY).
You may be thinking to yourself right now, “Guys, how can you be excited about a stock that’s already made a 123% move in 2 months?” The truth is some of the best winning stocks of all-time have displayed this exact price behavior before their real major price advances began. Stocks like Certain-teed in 1960-61 (low-cost housing), Syntex in 1963-64 (birth control pill), Qualcomm in 1998-2000 (computer networking), and TASER in 2003-04 (stun guns) all had revolutionary new products and ran up 80-150% in anywhere from 8-10 weeks. Typically, these stocks traded sideways over the next 3-6 weeks before bursting higher and advancing in the worst case up +100%, and in the best case +2566% (Qualcomm). The average gain of patterns like this falls somewhere between +400-500% over the next 6-12 months.
One thing is clear: Tesla’s short burst higher is indication that something big is going on (see the volume change in character on the below chart). Institutions caught underinvested in this stock in combination with short sellers having to buy at higher and higher prices suggests continued fueling of higher prices to come. For the 9 weeks ending May 31st, TSLA was up a vigorous 187%. This is among the best examples in our model book of stocks making strong price moves before setting up the pattern we described above.
While TSLA is currently exhibiting strong price action and we love its fundamental acceleration and growth story, price action is the only thing that now dictates whether or not we pursue a position. As of the end of May 2013, we did not and have never held a single share of this stock. Recall there is a right and a wrong time for every market action. Today, if the pattern emerges as we outlined above (3-5 weeks sideways with a less than 25-30% selloff from the high), the proper initial buy point for this stock would be new highs above $114.90 (its current highest ever price) in volume that is at least 50% above average (as of this writing, the stock trades about $950M of volume per day). Clearing this price in significant volume would demonstrate to us that buying pressure has resumed and that demand from large institutions far outpaces supply. What better economic situation?
Overall, leading stocks had a so-so month in May. This could lead to index underperformance in coming months, as indexes will typically follow the action of leaders. With many leaders now off their highs and forming constructive chart patterns, it wouldn’t be unreasonable for the indexes to take a break. Regardless of what they do, the action of leading stocks indicates to us that exposure on the long side of the stock market is very much warranted at these levels and that taking positions in the best names at attractive prices is still the way to outperform the broad indexes.
Sentiment & Psychology
As a high level of bullishness persists, we need to remember that an overly bullish market can remain that way for a long period of time. “The market can remain irrational longer than you can remain solvent” is a common quip about those who try to fight the action of a market. While Sentiment & Psychology coupled with History & Precedent (the next section) are secondary indicators to us, we still must observe and study them to help us develop a greater understanding of what’s happening in our current environment.
Breadth in May, as measured by the NYSE Advance/Decline line, continued to show strength through the middle of the month as the line made new highs. From that point, the line has been trending down, which is a negative sign. If we were to draw a trend line connecting the bottoms of the A/D line, the upward trend would have been broken as of the end of May. While not a sell signal in itself, this should give us additional reason to adopt a cautious stance into the coming month. Breadth has led into every correction thus far during this bull run, but is now lagging as the index struggles at psychological resistance levels.
As of the end of May, bullish investment advisors still handily outnumbered their bearish counterparts by a greater than 2:1 spread. The put call ratio reached levels at or near the bullish 1.2 reading twice in May, which could signal a false top or that further gains are to come. Remember that the market serves to fool the masses, and touching these levels for the first or even second time could be a head fake, for the market only to show its true intention upon the third test. While these indicators are secondary to that of the action of leading stocks and the indexes, such gauges can help us fine-tune our understanding of the overall market environment. As we cautioned last month, the growing number of advisors doing their own celebratory “mashed potato” should increase the level of care with which we go about our market operations.
History & Precedent
Every month we examine a period in market history where an index, a stock, or a group of stocks are following similar patterns to those that happened at some point in the past. This month, we shift our attention back to the period from October 1987-1989 after the “waterfall selloff” rocked the financial world (we covered this precedent in detail in November and December 2012). The beauty of precedent transactions is that many different periods can be relevant if you can remain flexible with your expectations.
While we’ve been thinking that the precedent from 1974-1980 was repeating itself, the action of the market is now more closely mirroring the 1987 to 1989 period. To that point, John Maynard Keynes once remarked, “When the facts change, I change my mind. What do you do, sir?”
On the charts that follow, I’ll step through the key items for this precedent period compared with charts and action of the market in which we are investing today. As always, history and precedent is a secondary indicator we use to simply guide our thinking as to what may transpire in the marketplace.
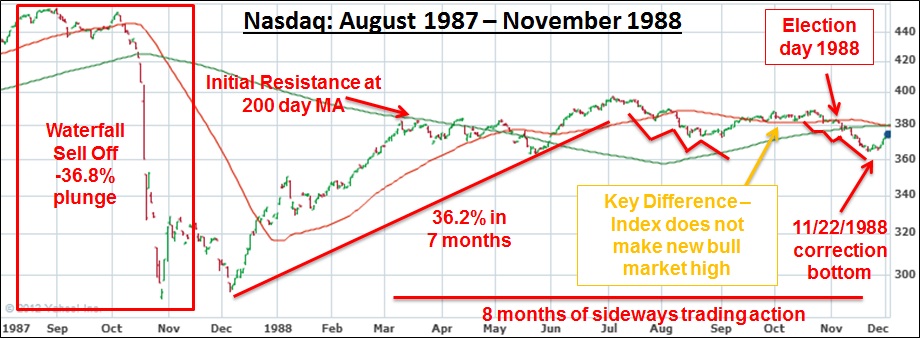
Everyone knows that October 1987 saw the sharpest sustained selloff in modern stock market history. In a matter of days, the Nasdaq lost 36.8% of its value. On the chart above, you can see I’ve labeled this selloff as a “waterfall selloff”. This type of selloff is more common than one might think (though none were sharper than the 1987 fall). A “waterfall selloff” is just as its name implies: a short period of market activity where the indexes seemingly go into free fall. After falling sharply in October and finally settling in December, the index went on a 36.2% tear over the next 7 months.
It’s worth noting that during this rise, the Nasdaq found initial resistance at its falling 200 day moving average before finally bursting to its short-term top in July 1988. From that point, the index traded in a choppy sideways action with 2 clearly defined sell offs, each containing a 3 waves down pattern. 1988 marked a U.S. presidential election year, and you can see from the chart that after George H.W. Bush was declared the winner, the index proceeded to drop into the 3rd and final wave down of its pattern, before bottoming on November 22, 1988. From the point where the Nasdaq initially found resistance at its falling 200 day moving average through its final bottom in November, 8 months had elapsed. The other key notable was the twin set of 3 waves down patterns that emerged.
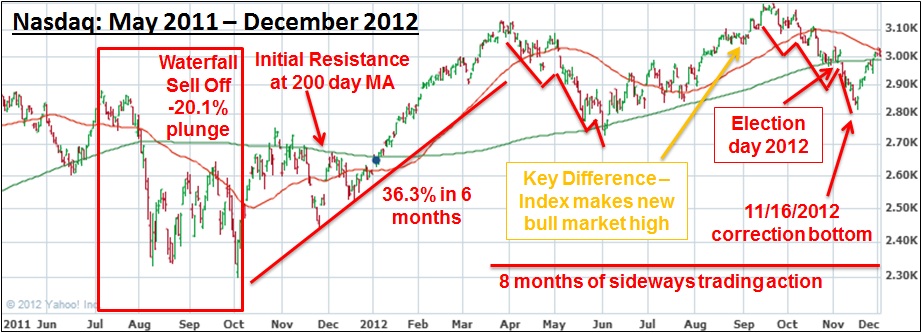
Comparing this action to that we are currently experiencing on the chart above, starting in May 2011 the Nasdaq started in a choppy period followed by a sharp 20.1% waterfall selloff plunge. From the 10/4/11 low, the index went on a 36.3% move over the next 6 months. I find this fascinating because the precedent above was only 0.1% less over a similar time period. From April to June, the index traced a 3 wave down pattern followed by support at its rising 200 day moving average. An extremely choppy 3 month uptrend then began, which created the only major divergence from the precedent above. The Nasdaq today cleared its March peak, whereas the Nasdaq in 1988 was unable to clear its first peak.
From there, the index entered another 3 waves down pattern, which included the 2012 U.S. presidential election. The result of the election introduced the 3rd and final wave down before the current market low on November 16, 2012. Since that point, we’ve been in a rally that resembles the 1988 precedent.
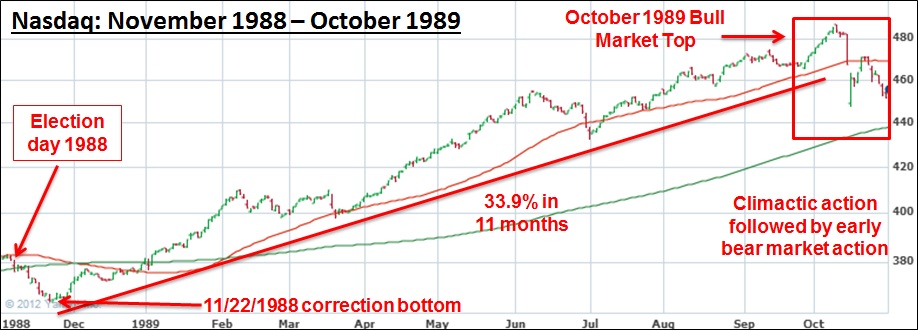
Given how similar the post-waterfall selloff reactions currently are, the chart above extends from the November 1988 bottom to the ultimate October 1989 bull market top. You can see that after 8 months of relatively sideways, choppy action (March-November 1988), the Nasdaq went on a 33.9% tear over the next 11 months culminating in the bull market top. We’ve labeled “climactic action” on the chart above, which is a period where the market seemingly goes straight up for no rhyme or reason. During these periods, leading stocks will often advance 25-50% or more. The result of this action was a sharp 1 week reversal marking the entrance of the 1989-1990 bear market. During the preceding 11 month market advance, many leading stocks produced gains of 100-200% or more.
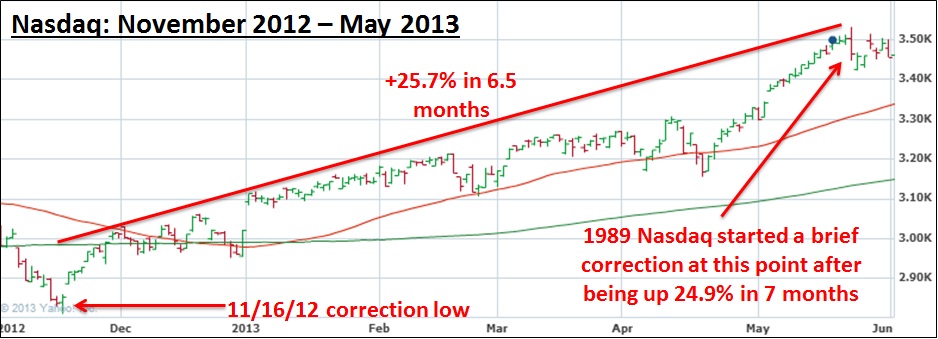
Finally, the chart above gives you a glimpse of how the current market is faring versus the period after the 1988 Presidential election. After a 25.7% gain over 6.5 months, the Nasdaq appears to be setting up to take a breather, much like it did between June and July in 1989 when the index saw a 5.3% correction. I find it again fascinating that the 25.7% rise from November 2012 to May 2013 is within 0.8% of the November 1988 to June 1989 time period.
The overall bull move from the 1987 waterfall selloff low to the October 1989 bull market high was +69.0%. From the October 2011 selloff low to the current May 2013 high, the Nasdaq has run 53.7%. From the July 1989 correction low of 431.72 to the bull market high of 487.60, the index ran 12.9% in 3 months. This precedent is by far much closer than the other we’ve been examining over the past few months and we must continue to watch it closely. If this precedent continues to play out and we enter a bear market in October, raising cash and getting defensive will be the best way to position a portfolio. As always, time will tell.
To close this section, we can’t be sure if the 1987-1989 precedent will continue to play out. The key to this precedent was the psychology and market action after a waterfall selloff. For other examples of waterfall activity, please look back to December 1914, October 1929, May 1962, March 1994, October 1997, and May 2010. All we can do is closely observe the market’s action and take exposure in leading stocks as the market grants us that opportunity. We must position our portfolios according to what the market is telling us. Blindly investing in good companies during choppy markets is a recipe for disaster. Right now, market action dictates we have long exposure and be vigilant about keeping our losses small and letting our winners run. If the precedent does continue to play out, you can be sure there will be BIG money to be made in coming months.
Conclusion
In summary, leading stocks by and large are acting well. After any sustained rally, it’s not uncommon for stocks to catch their breath before continuing higher. We might have seen the first signs of this in May as some stocks (and their respective sectors) began to cool off while others powered forward. A handoff of the baton from one group to another is what generally helps the broader indexes continue their ascents. Since stocks don’t exist in a bubble, we also need to factor the action of indexes and measure the relative amount of selling occurring there. As of the end of May 2013, professional selling has been increasing but is still at levels consistent with being invested on the long side of the market.
If further selling were to manifest in June, locking in profits and switching to a more defensive posture would be the optimal play. Only when leading stocks are not fighting the a downward trending broader market can we expect to see outperformance in a portfolio of growth stocks. As usual, we express a cautionary tale headed into June with potential psychological barriers of 3500 for the Nasdaq and 1700 for the S&P500. A solid break of those levels with positive action by leading stocks would be indicative of more gains to come. Of course, this level could also act as a ceiling that holds prices down for at least a few months. All in all, we’ll let our rules dictate how we invest in coming weeks. Have a great month!