We believe the bull market that started in March 2009 is still fully alive and intact and the correction we are currently experiencing is part of the larger bull cycle. Short corrections within larger bull markets allow stocks time to breathe before resuming their uptrends to higher and higher levels. In the sections below, we are going to outline our traditional 4 pillars of market health. Each pillar has its own importance (the most weight by far should be placed on pillars 1 & 2) that can help us put the market’s action into perspective. As large and as complex as the market is, we feel having some sort of regular roadmap to evaluate its action is of utmost importance.
Indexes
The first pillar of market health is observing the actual day-by-day action of many broad indexes. We look at (in order of importance) the Nasdaq, S&P500, NYSE, and the Dow Jones Industrial Average as our primary gauges of market health. The Nasdaq is the most important index because the young, upstart growth companies in America tend to list their shares on this index and those companies in turn are the ones that power the U.S. to new levels of innovation and value creation. Similarly, the S&P500 is a broad measure of business activity across 500 of the largest and most reputable companies in America. Both should be watched closely and their individual action should be held above all other indexes.
For the month of October, the Nasdaq fell 4.5% on heavy professional selling. The index also traced a very clear pattern called “3 waves down”, which we will discuss further in the History & Precedent section below. 3 waves down is a common pattern during market corrections/pullbacks and understanding its action is vital to positioning a portfolio correctly. What’s interesting is that the index hit fresh bull market highs in late September (counting from the bull market that started in March 2009) and has since reversed. As of this writing, the Nasdaq is just above its rising 200 day moving average, which proved to be the support point for the June 4, 2012 sell off low (see chart in History & Precedent).
The S&P500 fell 2.0% and so far has corrected much less than the Nasdaq, a sign that even though many firms listed on the index have been guiding lower for future quarters earnings, the damage being inflicted isn’t as severe with these firms. Expectation is the mother of all stock market returns and lowering expectations now with the potential for future earnings beats could help drive prices in future quarters. While the index has corrected less than the Nasdaq, it has also underperformed the Nasdaq this year. When evaluating both indexes together, watching for any signs of divergence (i.e. one index does something the other doesn’t) is helpful in identifying potential changes in trend.
Overall, as of the end of October 2012, all U.S. indexes are currently going through a correction. We feel this correction is likely to be followed by a resumed uptrend, but we can’t be sure on the timing. Perhaps clarity provided by election results on Tuesday could reignite an uptrend, or perhaps a short burst up could be followed by a further move to the downside. All we can do at this point is to position our portfolios in a defensive manner and be vigilant about staying on top of our research to find the potential big winners of the coming market rally.
It’s often said that “a bull market climbs a wall of worry”; while various economic gauges are showing us mixed signs, the index actions over the long-term indicate we are still in a bull market. Therefore, we must prepare ourselves to reap the rewards associated with big gains from leading stocks when the pressure on the market is finally relieved.
Leading Stocks
The 2nd pillar of market health is to follow the stocks with the best fundamentals in the marketplace. These are the companies providing innovative solutions to drive productivity and serve large amounts of people. We at Satellite Capital look for the following fundamentals: large and accelerating quarter-over-quarter earnings and sales growth (preferably 25% QoQ or higher), high returns on equity (preferably 15% or higher), solid 3 and 5 year growth rates (preferably 25% or higher), high levels of cash flow generation relative to annual earnings, and some product or service that is innovative and enriching the industry in which the company plays.
As you could imagine, given our preference for the large numbers stated above, the universe of stocks we’d want to invest in narrows quickly. It is rare to find a stock exhibiting all the above characteristics to the highest level, but they do exist. As the majority of all stocks listed on U.S. exchanges fail dramatically to meet the above criteria, striving to invest in companies that exhibit as many of the above traits as possible is key in outperforming averages in a rising bull market.
The month of October saw leading stocks in heavily distributive states. The goal in every bull market cycle is to find the “True Market Leader”, the stock institutions have to own because of its growth and ample liquidity. The TML typically runs for the entire length of a bull market and is often called the “it” stock that people love because it seemingly just keeps chugging upward. Many great TML’s through history drove great innovation in their times, catalyzing increased prosperity. We are better off because of these companies’ contributions: U.S. Steel, General Motors, Microsoft, Cisco Systems, and now Apple to name a few.
Apple is currently going through the heaviest volume correction it has experienced since its January 2009 low. From a low of $78.20 to a current bull market high of $705.07, the stock has produced solid gains and has yet to break any of the sell signals we employ. In solid bull markets like the one we’re in, the goal is to identify the True Market Leader as early in the cycle as possible, and to do as little trading in the position as you can. Correctly identifying and holding the True Market Leader can make life changing gains for an investor.
Other leading stocks are largely experiencing corrections as well. Corrections are constructive because they let stocks take a breather and shake out any weak holders who would be just as apt to sell as to hold. There has been a rotation away from technology and retail, the traditional routes from which leading stocks come, to more cyclical based plays. This is common of late stages in a bull market. A few stocks we are currently watching (but do not endorse, we are simply watching) include: KORS, DDD, CHS, CTRX, GPS, QIHU, URI, PNRA, ISRG, and CRM. This is a small subset of our broader, universe list, but these are the stocks closest to potential buy points pending certain signals are given off by broader indexes (3 out of 4 stocks follow the trend of the indexes, so why try to swim upstream?).
While stocks continue to correct, the best positioning comes by keeping your powder dry and staying diligent about your watch lists. Markets can turn very quickly and it’s not fun being caught unprepared when stocks that formed solid patterns with great fundamentals start taking off without you. We can’t be sure if the patterns formed will break out and produce solid gains, all we can do is wait, observe, and react when the time comes to take action.
Sentiment & Psychology
The 3rd pillar of market health is examining market sentiment and psychology. Understanding market sentiment and investor psychology is secondary in importance behind following the action of indexes and leading stocks. Looking at various gauges of sentiment and psychology is helpful when many indicators are at extremes. When indicators are at moderate levels, such gauges yield less useful information. No one indicator is better than another, and a good analyst will keep a dashboard of many indicators to help effectively evaluate the market. At key turning points, many indicators will tell the same story and flash similar signals (both positive and negative depending on our location in a market cycle). I’m going to examine three indicators in this commentary, here we go:
NYSE Short Interest ratio – Investors sell stock short (the opposite of buying long, only you sell today and have to buy tomorrow) in expectation of making money at a future point by selling at a price today and buying at a cheaper price tomorrow. Summing this across all investors, the NYSE requires members to report their outstanding short interest ratio on a bi-monthly basis. You can then calculate the average number of shares traded on an index per day and how many average days of volume it would take to clear all shorts in the system. At present, that number stands at about 19 days, which is not at its bull market high (the bull market high was above 22 near the September peak), but is still substantial for this point in the greater bull market rally.
Taken over the long-term, this indicator is best used as a contrarian view as to what will likely happen. At the top of raging bull markets, almost no one is selling stock short and the days to cover is extremely low. At extreme market bottoms, this gauge is fraught with fear and hangs near 5-year high levels like it is today. It’s tough to establish what the points in the middle of a move mean, so watching for extremes is the key. The fact that this indicator has nearly doubled over the last year is fairly significant and should indicate to us that any marginal improvement in the economy could lead to a substantial uptrend.
Investor’s Intelligence Bulls versus Bears survey – This survey asks investment writers a simple question: bullish, neutral, or bearish? Much like the NYSE Short Interest ratio, this indicator is most useful when it is at extremes. As of the end of the month, II reported 41.5% of writers were bullish and 27.7% were bearish. The bullish ratio peaked above 50% in mid-September, which has traditionally been a good gauge that things may be getting a little frothy. Anywhere between 50-60% is usually sign for caution, as the market serves to fool the greatest number of people. A bull uptrend indicator would be when the % of bearish advisors crosses above those who are bullish. At this point negative sentiment has set in, creating the opportunity for the market to fool the greatest number of people and burst to the upside. While the 41.5% of bullish responses from the last poll isn’t significant, it is about 10% off its high, while the bearish responders are barely off their low. It is possible for the market to resume an uptrend and start running, but a few more weeks of bearishness building wouldn’t be uncommon.
AAII Sentiment survey – This survey is put out weekly by the American Association of Individual Investors. It asks individual investors of all types on a weekly basis the exact same question as the Investor’s Intelligence survey above, it just surveys many more respondents. As of the last reporting, the bulls % stood at 35.7% while the bears % stood at 41.0%. Note the divergence between investment writers and general investors here. Bears clearly outnumber the bulls in this poll. Historically, individual investors are much more receptive to what the market is doing. Like the prior 2 indicators, we are looking for readings at extreme levels. Presently, there exists enough bearishness to start an uptrend, but that alone is not enough reason to buy. We need to watch this indicator weekly to see when it finally gets into sync with the others, which is usually when a market uptrend sets in.
In conclusion, current readings on sentiment are not at extreme levels, though they are well off their late September highs. No one indicator should be used as your green-yellow-red light system, but rather an investor needs to have a dashboard of indicators to help them get a sense for the investing climate. Remember that this pillar is secondary in nature to the action of the indexes and leading stocks themselves, but should be used to help you craft a picture of the bigger macro environment. A good investor utilizes many different gauges to sense when it’s time to position themselves for gains.
History & Precedent
The 4th and final pillar of market health is examining history and precedence. This is the least important compared with the other 3 pillars listed above, but can often provide insights into the market’s action that may resemble prior periods of market action. History repeats itself whether we like it or not, and those who forget history are doomed to repeat it. For example, every 32-36 years the same style of bear market happens (1872, 1906-07, 1937-38, 1973-74, 2007-09) where the broader indexes lose 50% or more of their value. I’ll explore this recurring theme in future months.
On the charts below, I’m going to examine a phenomenon in the market called 3 waves down. Typically, this involves 3 distinct moves down that are interrupted by 2 short bursts up. The pattern is too common in the market to disregard, and the examples of it are numerous.
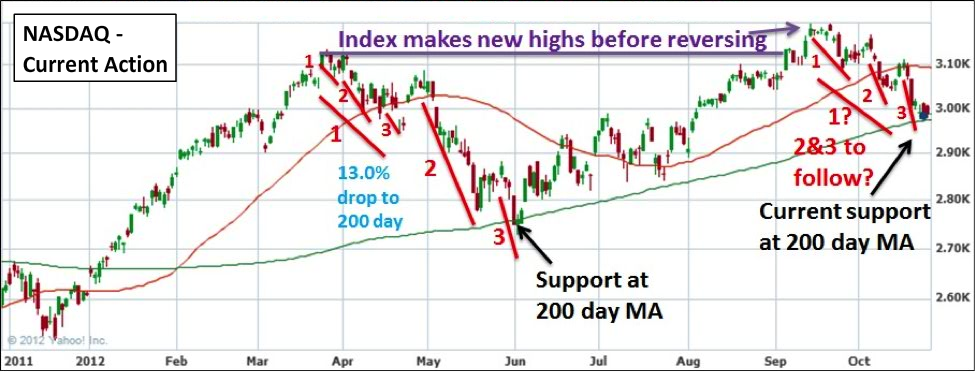
First, let’s take a look at the action of the Nasdaq today. Starting on the left side of the graph, you can see I’ve labeled 1-2-3 for short waves and the same for bigger waves. When the Nasdaq hit a short-term top in March 2012, 3 short waves down were followed by a burst up, another solid leg down (2), one last burst up, and finally the last wave down (3) to the correction’s bottom. A key detail of this correction is that there were 3 shorter waves down within the first wave down. This is VERY common and in the following precedent examples I’m going to demonstrate this fact.
After selling off to its June 4, 2012 correction low, the Nasdaq went on a rally and made a new bull market high in September 2012 (labeled in purple). From this point, the market has traced a short 3 waves down pattern that has taken 7 weeks. It’s too early to know whether this will simply be the first big leg of a larger 3 wave pattern, or whether the market has traced its 3 waves and is now ready to resume its uptrend. This analysis simply seeks to demonstrate that very distinct and observable patterns have appeared and we need to take caution upon seeing them.
The last noteworthy item about the Nasdaq’s action above is the constant support the index has received at its rising 200 day moving average (labeled in black). During the 3 bigger waves down, the Nasdaq fell 13.0% to its 200 day MA. In the 3 short waves that have been traced today, the Nasdaq has fallen just over 7.0%. In the precedents to follow, you will notice many common themes among corrections of this nature.
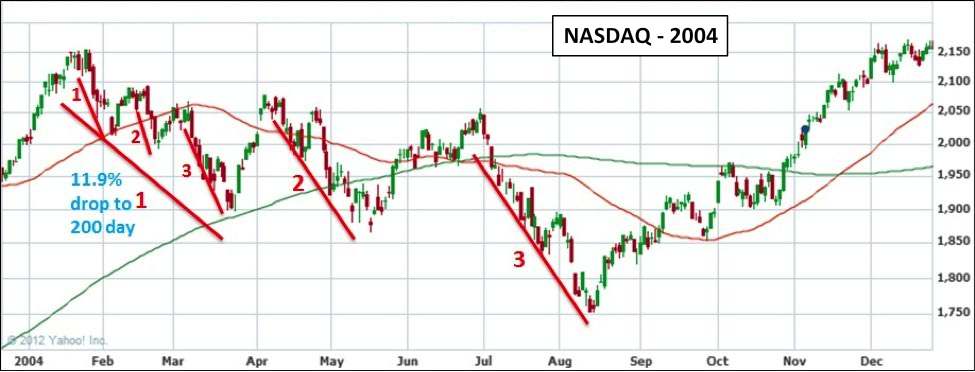
Exploring our first precedent action, you can see above that from January to August 2004, the Nasdaq traced a similar 3 larger waves down pattern with 3 shorter waves within the first bigger wave. The fall from the January ’04 peak to the 200 day moving average was 11.9% and coincided with a short bounce off that line before finally later falling in down waves 2 and 3. The depth of the full correction from January to August was 18.7%.
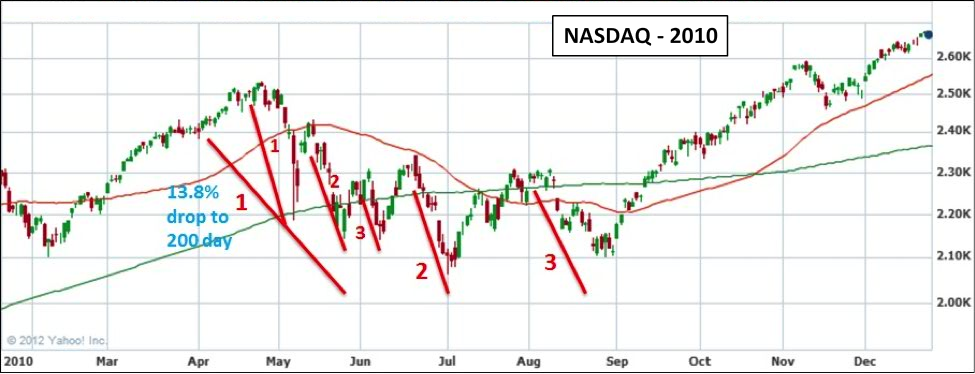
The next precedent is a little bit closer to recent memory. This involves the Nasdaq’s action during the summer of 2010. The same short 3 waves are traced above within the first larger wave, followed by 2 final waves down resulting in a solid bull market uptrend. If you look closely at the small 1 within the first wave, you will see the “Flash Crash” on May 6, 2010. During this first wave down, the index fell 13.8% to its 200 day moving average. The total depth of this correction from late April to late August was 18.7%. If that number sounds familiar, it’s because you just saw it above from the 2004 correction. This could be pure coincidence, but the action of the corrections and length prove too similar to discount the action.
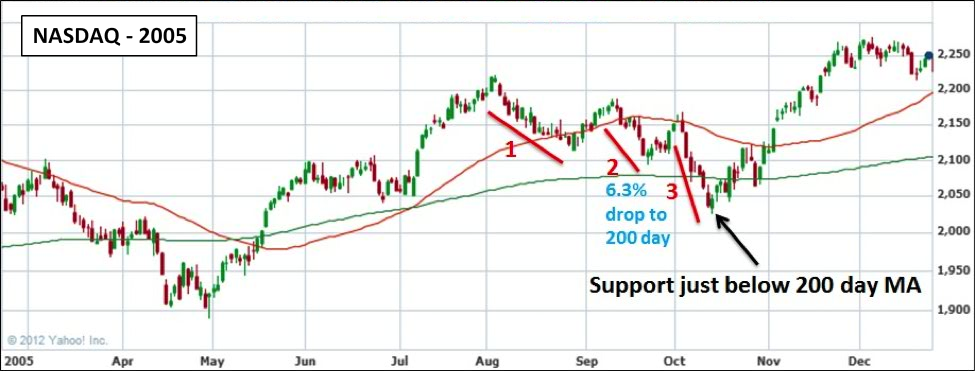
The next precedent is a bit different in nature, in that it only had 3 waves down followed by a renewed uptrend. There were not 3 waves within the first wave, making this correction much shorter at 2 full months. Above you see the Nasdaq in 2005. From its peak in early August to its October low, the index corrected 8.7% before finding support just below its 200 day moving average and resuming a bull market uptrend. The total depth of this correction is much more similar to what we are seeing today, currently off 7.0% through 3 distinct short waves and finding support just above the 200 day moving average.
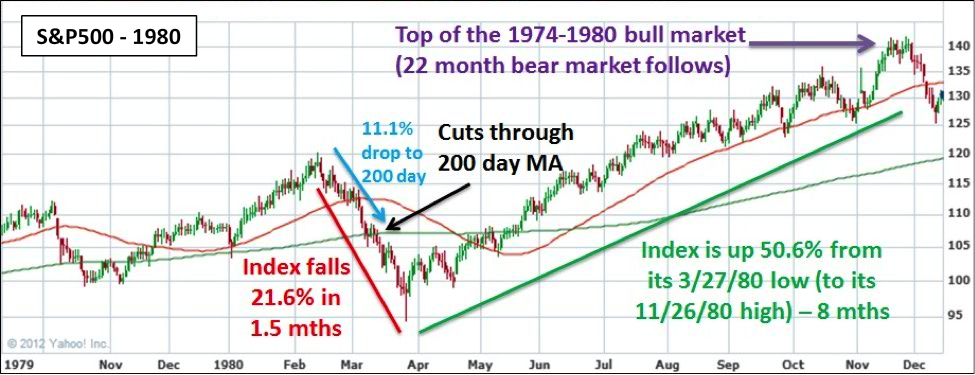
Lastly, I’d like to offer one different take on the current action. If you look at the chart of the S&P500 above, you will note that this action is all the way back from 1980. 1980 was the last year of the bull market that began in 1974 and was the last bull market of the secular bear market that started in 1968. I will discuss secular bull and bear markets in future writings, but just know that these are much bigger cycles where the bull markets continually show price progress to the upside (look at a S&P500 chart of 1982-2000) and the bear markets essentially trade sideways over a long period of time (look at a S&P500 chart of 1968-1982).
The key is that the above chart is the last major market correction before the end of the bull market that started 6 years earlier. A 2 year bear market set in afterward (November 1980 to August 1982), followed by the very strong secular bull market that started in 1982 and lasted 18 years. Your team at Satellite Capital feels we are nearing the end of the secular BEAR market that started in 2000 (take a look at some long-term charts, the indexes have essentially traded sideways for almost 13 years now). At the end of this bigger bear cycle, a bull cycle will resume. We can’t know exactly when that will be, but we can use current market action combined with history and precedent to see how these prior secular bull and bear markets started and ended.
From February to March of 1980, the S&P500 dropped 21.6% over a 1.5 month stretch. After this period, the index went on an absolute tear, rising over 50% in the next 8 months. We find it interesting to note that Ronald Reagan was elected in November 1980 at the top of the bull market. He endured a 22 month bear market during the first 2 years of his presidency before his policies gripped in combination with the action of Fed Chairman Paul Volcker. This fiscal and monetary situation helped propel the market for the next 18 years.
Now a note about the election on Tuesday: While we are split down the middle on who we’d like to be in office for the next 4 years, the one thing we can agree on is that the market will act to fool the greatest number of people. All we can do at the present is encourage each and every person to exercise their civic duty by voting. Regardless of who wins, the market is forward looking, reminding us we should never argue with its current action. When the market shows us it’s time to be heavily invested for the next great bull market, you can be sure that we at Satellite Capital will be there at its inception to take advantage of the action.
To close this section, we can’t be sure which of the different scenarios above will play out. All we can do is position ourselves cautiously knowing that the market will dictate to us how we should act. If we listen to it and observe its signals, we can put our portfolios in place to generate solid returns. The best thing to do right now is to stay cautious. It’s possible that over the next few days and weeks, we’ll have a clearer resolve as to how we should be investing.
Conclusion
In summary, as the market continues to go through this correction, the best odds are to be safely on the sidelines in cash (unless of course you’ve made significant progress on a position and can afford a small give back). With election results on Tuesday (or more likely Wednesday), some clarity may be given to market participants that could help setup a continued uptrend. When the uptrend resumes, we should closely watch the action of leading stocks, as they will tell us when it’s time to wade back into the waters. We hope you have a great November and we’ll be back in early December with an analysis of November’s action. Please exercise your civic duty on Tuesday the 6th and be sure to place your vote. Lastly, we’d like to wish you an early Happy Thanksgiving!