Many important developments rocked the market in June. The most notable was on June 19th, when U.S. Fed Chairman Ben Bernanke talked about pulling away the proverbial Quantitative Easing (QE) punchbowl, perhaps starting as early as this fall. Currently, the Fed is buying $45B per month of U.S. long duration Treasuries (generally with maturities greater than 20 years from now) and $40B per month of mortgage backed securities. The goal of this effort is to keep yields low (bond prices are inverse to yields) to help stimulate economic improvement. Action could be taken at any of the Fed’s remaining 2013 FOMC meetings: July 30-31st, September 17-18th, October 29-30th, and December 17-18th. Assuming the U.S. economy continues on its current trajectory, the Fed could slowly taper its stimulus efforts to see how the economy performs without being propped up by overly-stimulative monetary policy.
Based on our current market analysis, we feel the selloff we’ve been looking for over the past few months has finally emerged. This downward move is definitely part of the larger bull market and we likely have not entered a bear market at this time. A healthy correction would likely last anywhere from 3-5 months, ending by our estimate at some point in August (likely with a bang). Our current interpretation sees an aggressive upwards move originating off the eventual market low and lasting until approximately March 2014, which would mark an important bull market top (61 total months for the bull market, in line with similar historical bull markets).
The first wave down for the current market move appears to have been completed between May 22nd and June 24th. At the bottom, secondary indicators were screaming that markets were oversold and likely due for a bounce. The news was also worst at the bottom (the FOMC announcement and Chairman Bernanke’s press conference accelerated the selloff to the June 24th current low). I’ll examine the relationship between the news, fundamental data, and technical market action in the sections that follow. Again this month, l’ll examine the 1974-1980 bull market precedent that we’ve been exploring just about every month since we’ve been writing this commentary (the precedent is that relevant to what’s happening today).
I’m going to dive right into analysis under the assumption that readers of this commentary have read our previous installments and have developed a basic understanding of our approach to the market. For first time readers, I recommend reviewing our February 2013 Commentary and earlier to ascertain a detailed explanation of why we at Satellite Capital examine what we do, and why we are interested in certain stocks over others. And as always, please don’t hesitate to contact Thomas or myself with any questions.
Indexes
For the month of June, both the Nasdaq and the S&P500 fell 1.5%. Both indexes set their current bull market highs on May 22nd and have since been trending lower. Since that key day, the Nasdaq has racked up 8 days of high volume selling and the S&P500 has chalked up 7 over the last 27 market sessions. We count “selling days” as days with higher volume than the immediately preceding market day and price action that falls at least 0.2-0.3% for the day. At May’s end, the Nasdaq had 3 days of selling while the S&P500 had only 2. Caution is to be heeded when these counts approach 4-5, thus the current environment is definitely distributive rather than accumulative.
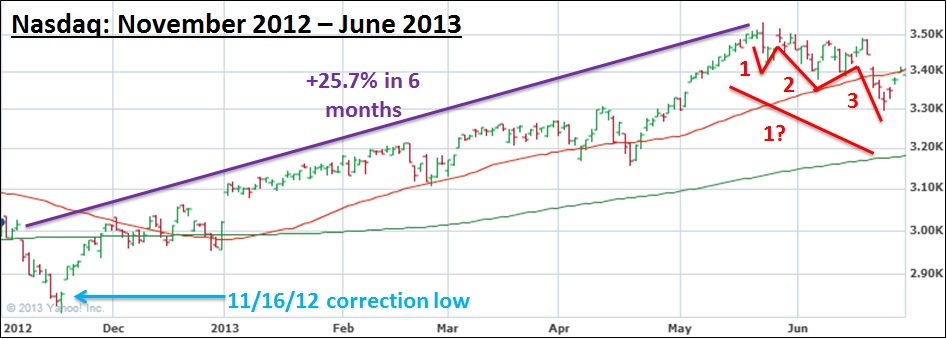
Despite my comment last month that perhaps May wasn’t the “time to sell and go away” (a pundit favorite), perhaps it actually was. Both indexes made fresh bull market highs in May, but have experienced heavy resistance around round numbers, which are usually good psychological barriers. The indexes often move in waves of 3, so the move from late May to late June could be the first of those 3 waves. The Nasdaq dropped 6.7% over this time and the S&P500 fell 7.5%. 3 waves isn’t a hard and fast rule, but the pattern is common enough because of the psychology behind it. We’ve examined the pattern in prior months, but let’s discuss in depth why it occurs and how the psychology works:
Wave 1 – The market begins to sell off its highs and most participants feel the selloff is just a normal correction that will likely right itself within a few days or weeks. A bounce off the Wave 1 low helps these investors to justify their feelings and they then make the commitment to hold onto their positions. Fresh buyers, who were waiting for any type of sell, jump into the market, as this is likely their first opportunity after missing the boat before.
Wave 2 – After a short bounce which helps strengthen long-side convictions, a sharp move to the downside commences as a greater number of participants look to sell at any price. Information the market was likely pricing in during Wave 1 down starts to come out, which causes investors to panic for the exits. Those investors who had resolved to hold their long positions in Wave 1 start to worry that maybe the correction will prove more than they can handle, and now contemplate liquidating their positions.
Wave 3 – After an aggressive 2nd wave down, the market likely bounces once more, helping our troubled investors to feel better about their positions and that they were justified in holding. As the market always serves to fool the greatest number of people, it usually turns south one final time and undercuts the Wave 2 low, crumbling the remaining resolve of our long investors and prompting them to bail on their positions. This happens time and time again, right at the bottom of the market on an undercut of the Wave 2 low. The bottom of Wave 3 can be characterized by complete capitulation and a triumph of supply over demand (a state of selling exhaustion). Bad news that started emerging during Wave 2 is generally fully known within a few days or weeks of the Wave 3 bottom, demonstrating that news is always worst near important market bottoms.
The psychological analysis of these patterns is striking. How many of us have been caught in positions that we’ve just wanted to ditch, and we’re stuck hoping the market is going to about face and rebound only to see the opposite transpire? It’s happened to every great investor I’ve had the privilege of meeting. This pattern continues over time because people are involved in the market, and human psychology doesn’t change.
Quickly comparing this against the move down over the last month (each move is labeled accordingly on the chart that follows), the 1st down wave started on May 22nd and ended on May 24th. Fresh buying came in after the selloff on May 24th, which marked enough of an up move to reel in and capture wary investors. From May 24th through June 6th, the market fell sharply, forming the 2nd down wave. From June 6th to June 18th, the market chopped around and attempted to move higher, pulling in value buyers and strengthening resolve on the long side. Finally, from June 18th through June 24th, the Fed news was interpreted by the market and the indexes dropped straight down for 4 consecutive sessions, which included an undercut of the June 6th low and a massive increase in volume to the downside, marking the end of the 3rd wave down.
This type of analysis can be applied over larger cycles as well. The whole move from May 22nd to June 24th could be seen as the 1st of 3 larger down waves that will hit the market (labeled “1?”). Given the highly distributive state, the nature of the move, and the action of leading stocks we follow, this is currently the outcome of highest probability. If conditions change, we’ll happily adjust and shift with them, but until then we’ll continue to tread lightly and take select opportunities on both the long and short sides of the market. Remember that such analysis is a science when examining the indexes throughout the past, but an art when attempting to interpret the moves in real time.
For now, the indexes appear to have started a bounce back from the 3 waves down pattern presented above. We can consider this pattern closed if and only if the indexes are able to rebound to new high ground. If after a few weeks the indexes turn back south without making a new bull market high, the scenario that we’ve laid out with “1?” is likely to be correct, indicating we could be in store for much steeper losses on the indexes before an eventual bottom. As investors, we need to prepare for both situations to unfold until additional data reinforces our conviction either way. We accomplish this by being invested long during the bounce, yet poised to cut bait and run (or to begin positioning ourselves on the short side) at the first instance of institutional selling. As of June’s close, the market definitely has more bearish undertones to it, despite still being in the larger bull market that started in March 2009.
Leading Stocks
Leading stocks had a generally negative performance in June, strengthening our thesis that the current correction will last longer than just a few weeks or even 2 months. During sells, the best stocks will fight the downtrend and will etch patterns that demonstrate resistance to the downward move.
A stock we had been following closely, ARMH, got absolutely clobbered and now sits 28.3% below its all-time high. Market corrections are often preceded by or coincide with damage to leading stocks. In its present state, ARMH has fallen off our immediate radar. The price action over the last month demonstrates why it is absolutely vital to have sell rules on any positions entered. Capping losses between 5-10% would have saved investors a boatload of money on this position (we’ve never owned a share, but this demonstrates that if we had, we wouldn’t have frozen on the negative price action).
Other leading stocks we’ve been following closely performed as follows: CELG = -5.4%, HTZ = -4.0%, LNKD = +6.4%, QIHU = +5.4%, and TSLA = +9.8%. We’ve also pulled FB off our target watch list due to a continual deterioration in its technical action. While its pattern isn’t all that bad, the stock has much to prove before it can warrant our investment dollars.
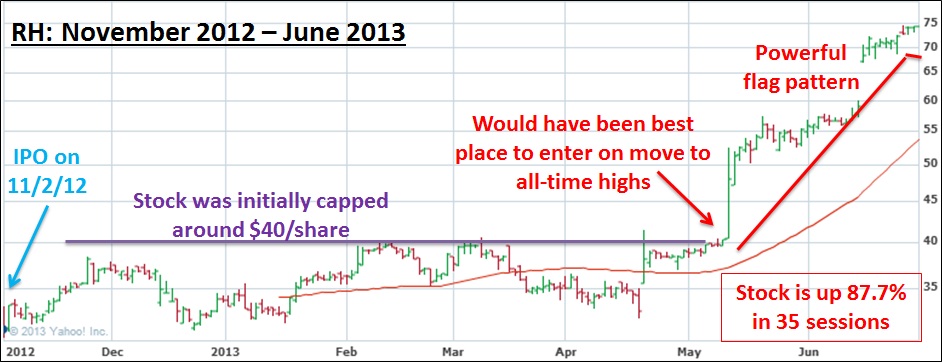
A new addition to the list this month comes in the form of recent Sears spin-off Restoration Hardware (NYSE: RH). Since its IPO in November 2012 (excellent timing), the stock is up 149% (+43.4% in May and +34.2% in June). Moves like this happen amid strong institutional demand for shares, coupled with a compelling growth story and earnings and sales figures that outshine the masses. RH’s dramatic move is also sector-based, as the housing sector has been on a tear and plays related to housing have seen strong moves. Ancillary plays to the main story generally enjoy less attention from the investing public, enabling such stocks to run longer. The story behind RH could be that with the increased number of homes being sold and renovated, individuals now need to furnish those spaces. I’ve purchased from them on 3 different occasions over the last year and have been fairly pleased with the overall experience and the quality of items purchased.
Given RH’s price action, you may recall last month we examined how TSLA appears to be headed straight to the moon. I encourage you to review last month’s write up of TSLA including the historical precedent for the price action and the innovative growth story driving its shares higher. RH is setting up in a similar fashion and accordingly, we need to watch it closely. While we don’t own shares, we’re watching for an area of consolidation that could offer a proper entry point. If the market sells off as we’re thinking it may, this could be a great opportunity for the stock to take a breather before continuing higher into the eventual bull market top (possibly next year). As usual, strict discipline on entering and exiting positions is mandatory and thus we don’t currently have a price at which we’d like to obtain this stock.
Overall, the market selloff in June handed leading stocks a down month. We pointed out last month that the so-so May performance “could lead to index underperformance in coming months as indexes will typically follow the action of leaders,” and that observation was right on the money (pun intended). With leading stocks already in correction mode, greatly reducing exposure to the long side of the market is the best play at this point. Only with gains of >40% on a leading stock would we condone holding through the current correction. Otherwise, select shorting of indexes in the coming month could prove profitable for the well-researched investor. Stay tuned to see what plays out in July!
Sentiment & Psychology
Near the selloff lows in late June, various indicators screamed they were at extremes. One is the Put/Call Ratio, which measures the number of puts (options expecting a fall in asset prices) versus calls (options expecting a rise in asset prices). Typically, this ratio reaching a level of 1.2 puts to every 1 call marks a turning point on the indexes (at least for a short period of time). This was true both on June 24th and a few days beforehand. Given this fact, we weren’t terribly surprised to see the short bounce into June’s end. Leveling out at a normal range (0.6-0.8 puts per call) would prove the correct psychological time for real selling to kick in (remember, the market serves to fool the greatest number of people).
Another indicator, the NYSE overbought/oversold oscillator, is calculated by taking the difference between advancers and decliners over the last 10 days and averaging the result. “Oversold” readings come between -1000 and -500 while “Overbought” readings typically range from +500 to +1000. In mid-May, the index hit +1000 for a few days, which signaled the overbought market top. After deteriorating for a month straight, the indicator reached close to -1000 in early June. As you might expect, the reading bounced to roughly neutral ground (zero) before declining sharply to the current selloff low on June 24th, where the reading again reached close to -1000. This, in combination with the put/call ratio above, proved to be a solid indication of what the market was likely to do next: bounce higher (though this isn’t always the case).
Lastly, our trusty breadth measure, the NYSE Advance/Decline line, has continued down its decidedly negative path (as pointed out last month). The A/D line has broken through a rising trend line, giving us cause for concern that this market move has legs to power much higher. The last time this happened was in June 2011; after rebounding for most of July, the debt ceiling debacle of August 2011 took hold and the major indexes plunged better than 20% in just a few months. Declining breadth has marked the start of every correction within this bull market, so we must take careful note of the current rising A/D action.
One final reminder is that sentiment and psychology-based indicators are secondary in nature. The most important action is by far that of the indexes and leading stocks. Both Sentiment & Psychology and History & Precedent can help us work towards a deeper level of understanding of a given market environment, but we need cement in our minds that they are of secondary importance.
History & Precedent
This month, we’re going to take yet another look at the 1974-1980 bull market that we’ve examined numerous times over the last 11 months. The beauty of precedent periods is that many often resemble current market action, and remaining VERY flexible with expectations we develop allows us to craft a working roadmap for what could lie ahead. As of now, the 1974-1980 precedent along with the 1987-1989 precedent are the two likeliest/most relevant scenarios I’ve found (and I’ve scoured my market history to identify periods that best align with what we’re currently experiencing).
As always, History & Precedent is a secondary indicator and we use it to simply guide our thinking as to what may transpire in the marketplace. The charts and discussion that follow are merely our attempt to convey similarities that we’re seeing between 2 very different historical time periods. I encourage you to read our other write-ups on the 1974-1980 precedent in our April 2013, March 2013, January 2013, December 2012, October 2012, and September 2012 monthly commentaries.
This month I’m going to examine the action of trend lines during the precedent bull market and our current bull market. At the end of the section, I’ll graphically present how we feel the waves discussed earlier are playing out for this bull market versus how they looked in the precedent bull market. I’ve touched on this subject in prior commentaries, but I felt an update was necessary to help our readers develop a more complete picture of the 3D jigsaw puzzle that I’ve mentally pieced together. Hopefully this effort will help you gain some insight into how we are evaluating the current bull market.
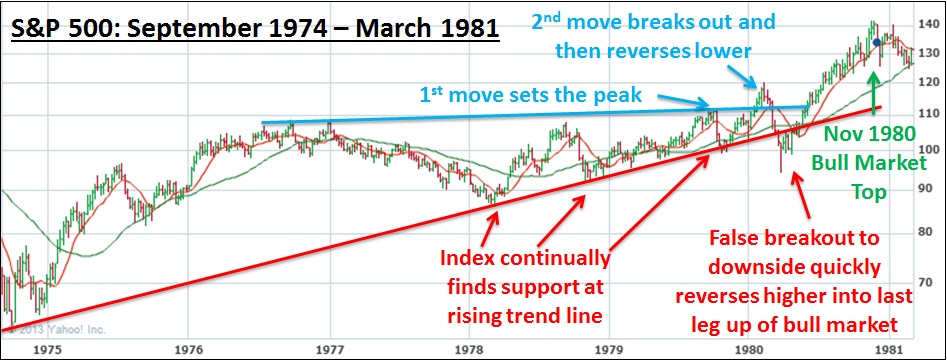
The first chart above (S&P500 between September 1974 and March 1981) includes several things I would like you to notice. Starting from top in blue, I’ve drawn a trend line across the peaks that came about midway through the bull market. After touching/nearly touching this line twice, the market had a fake-out breakout above the line before abruptly reversing lower. The next time the market rose back to this line it shot north without any problems.
On the bottom half of the chart, I drew a red trend line connecting the lows of the move from the October 1974 bull market beginning. After finding support at the line for an extended period of time, a sharp down move in February and March 1980 created a fake-out breakout to the downside below the line, before reversing strongly higher into the bull market top that came 8 months later (November 1980, the month Ronald Reagan was elected President of the U.S.). At its lowest point, the index reached about 10% below the rising trend line (after falling 21.6% from its peak). Over the next 8 months, the S&P500 rose an astounding 50.6%.
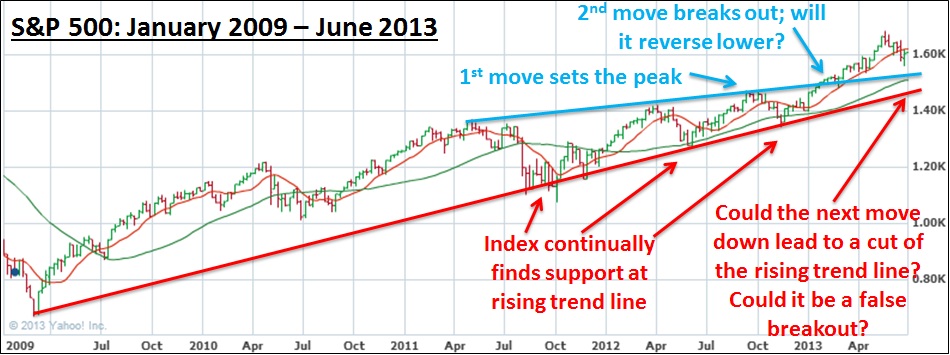
In our current market, you can see the same phenomenon has developed on the top-side trend line in blue. After testing the line a few times, the market has broken above and so far has held above the line. If the market were to reverse lower back below the trend line, this would suggest further we could see a sharp downtrend over the coming months. The rising trend line in red across the lows of the bull market has thus far remained intact. At its current levels, if the index were to repeat its early 1980 precedent and reverse sharply lower below the blue trend line and have a fake-out breakout below the red line, the S&P500 would fall to somewhere between 1266 and 1343 (about 10% below the trend line). Mirroring the 50.6% climb after the fall would land the S&P500 at approximately 1964 for a potential 2014 bull market peak.

Above you can see how we’ve marked up the 5-waves pattern for the precedent bull market. The down waves 2 and 4 marked corrections greater than 20% each. The total bull market lasted for 74 months. The key divergence thus far with our current market is that of Down 2 above. This move took 19 months, while what I’m calling Down 2 in our current market took only 5 months. If we subtract this difference of 14 months off the 74 month total bull market duration, we get a total run of 60 months for our current bull market that started in 2009, which would suggest a current bull market top around March 2014. This measure is perfectly imprecise, but such is true of any History & Precedent analysis. Correlation doesn’t necessarily lead to causation.
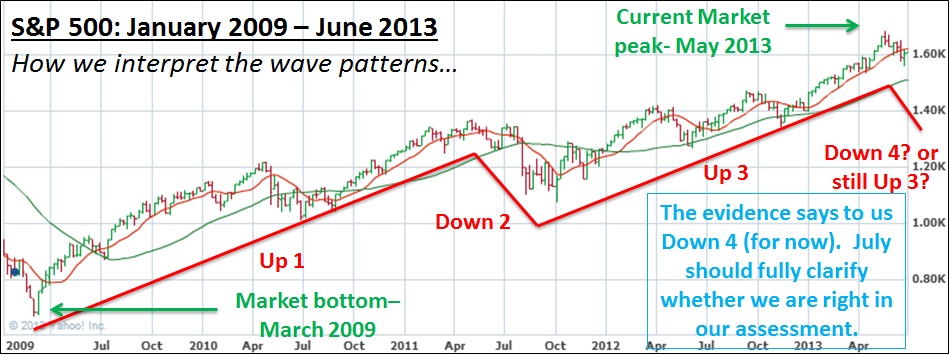
Based on the market evidence we see and as presented in our Indexes section above, viewing the selloff over the last month as the 1st of 3 waves down is the current highest probability interpretation. If this is the case, we would likely be in Wave Down 4 for the larger overall bull market, which could put us within about 12 months of the ultimate bull market top. This is what the evidence says thus far; if the indexes were to reverse higher and make new bull market highs, we could be seeing a continuation of Wave Up 3. We expect this dilemma to be clarified via July’s market action.
To close this section, we can’t be sure if the 1974-1980 precedent will continue to play out. The key is observing day-to-day price and volume action of indexes and leading stocks and utilizing that information to interpret the action in context of a bigger market move. We must position our portfolios according to what the market is telling us. Blindly investing in good companies during choppy markets is a recipe for disaster. Right now, market action dictates that we greatly reduce long exposure or even seek moderate short exposure, and be vigilant about keeping our losses small and letting our winners run. If the precedent does continue to play out, you can be sure there will be BIG money to be made in coming months (on both sides of the market).
Conclusion
In summary, the indexes are currently in a highly distributive state, which at least in the short-term puts the balance of power in favor of supply over demand. This situation doesn’t always mean lower prices, but when you are playing a game of probabilities, you need to put the odds in your favor as much as you possibly can. The weak action of the indexes combined with the fact that most leading stocks are going through corrections definitely leaves something to be desired. Remember, we’re not at all saying the market can’t reverse and proceed higher from this point. All we’re saying is that in the near short-term, probabilities suggest the market will continue lower.
Maintaining a defensive posture into July is the best bet for an investor given current market action. To be confident of a renewed uptrend and to push us into the bullish camp, we would need to see the Nasdaq clear its current bull market high of 3532 and the S&P500 clear its current peak of 1687. If the market moves higher off its low for a few weeks and then reverses downward, we expect we’ll continue lower for a few waves, possibly into August or as late as October. After that time, we would look for the market to rise aggressively into an eventual 2014 bull market top.
Regardless of how the coming months transpire, we’ll let our rules dictate how we invest. We need to remain flexible and open to change. As Charles Darwin once offered, “It is not the strongest of the species that survives, nor the most intelligent, but the one most responsive to change.” As investors, we must be open to any and every possibility and be prepared and willing to change our stance as further evidence presents itself. The second we become inflexible with our expectations is the second we open ourselves up to a massive amount of risk. Have a great month!