The big Federal Reserve news from March was the March 19th FOMC meeting statement and projection release, and the ensuing press conference at which Chair Janet Yellen spoke. FOMC participants concluded that economic activity since the January meeting was strong enough to justify tapering monthly security purchases by another $10B to $55B per month ($25B/month of MBS and $30B/month of long-term U.S. Treasuries). Participants also saw fit to remove the 6.5% unemployment threshold, given as the level at which it would make sense to think about raising interest rates for the first time since December 2008 (when rates fell to the 0-0.25% range). From the projections released with the statement, we surmised that most committee members expect the Fed funds rate to be 0.5-1.0% at the end of 2015, 2.0-3.0% at the end of 2016, and 3.5-4.0% as the desired long-run rate.
But the more interesting news came from the press conference after the statement and projections release. While answering a question about how soon rates could rise after Quantitative Easing ends, Chair Yellen remarked that the Fed could start to raise rates as early as 6 months after the asset purchase program winds down. Market pundits interpreted this to mean Q1 or Q2 2015, well ahead of the late 2015 rate increase projections that have been anchored by Fed speak for some time now. Market participants apparently didn’t like what they heard, as the selloff that started on March 7th continued through the end of the month.
Turning to the economy, February non-farm payrolls came in at +175K versus expectations for +149K, January payrolls were revised higher to +129K (from +113K), and December payrolls were revised upward to +89K (from +75K), marking a net addition of +25K. The unemployment rate (U3) ticked back up to 6.7% from 6.6%, and the labor force participation rate climbed a little off its low to come in at 63.0%. The main explanation given for the unemployment rate ticking back up by a tenth was that workers who were not previously looking for jobs came back to the job hunt and declared they were again looking for employment. The third reading for Q4 real GDP growth came in at +2.6% versus the second reading of +2.4%, while Q3 real GDP growth came in at +4.1%. Personal Consumption Expenditures (PCE) was larger than previously estimated, while private investment in inventories and intellectual property products was smaller than previously estimated.
After a very strong month in February, March was one to forget for leading stocks. Leading stocks (i.e. those with the best fundamentals– EPS growth, sales growth, high ROE’s, etc.– and the best technical action– price moves higher in stronger volume, support at key moving averages, etc.) were obliterated in March. As of the end of March, the average leader among the top 35 stocks we’ve been watching was about 20% off its late-February/early-March high. This is serious technical damage and will take a lot of work to repair. Despite the carnage, some leaders are still holding up alright and could go on to form price consolidations before eventually moving higher in the coming months. The others could be done for the rest of this bull move.
This month, as we have every month since August 2012, we’ll break our market analysis down into our 4 pillars of market health: 1) The action of the indexes, 2) The action of the best leading stocks, 3) Sentiment & Psychology-based indicators, and 4) Historical precedent action. Remember that Thomas and I place the most weight on pillars 1 and 2 (our primary measures of market health) when performing our analysis. Pillars 3 and 4 are important, but are secondary indicators in nature and need to be treated as such.
I’m going to dive right into analysis under the assumption that readers of this commentary have read our previous installments and have developed a basic understanding of our approach to the market. For first time readers, I recommend reviewing our February 2013 Commentary and earlier to ascertain a detailed explanation of why we at Satellite Capital examine what we do, and why we are interested in certain stocks over others. And as always, please don’t hesitate to contact Thomas or I with any questions.
Indexes
For the month of March, the Nasdaq fell 2.53%, the S&P 500 climbed 0.69%, and the NYSE Composite rose 0.98%. March was a month of divergences, as the Nasdaq and the Russell 2000 careened lower and the NYSE Composite, the S&P 500, and Dow Jones Industrials all made positive progress. Each index managed to close the month above their 50-day moving averages even though the Nasdaq spent about a week under its 50-day line near the end of the month. The 50-day moving average (simple or exponential) is often used as a gauge of strength or weakness for a market, and all of our indexes are still exhibiting solid strength by that measure.
Also notable this month is the action of the 3 key Dow Jones-related indices: the Industrials, the Transports, and the Utilities. First, the famous “Dow Theory” states that the Industrials and the Transports should move in sync, so one index making a new high (or low) should be confirmed by the other. This confirmation constitutes a buy or sell signal (or at least a confirmation of an existing trend signal). As of the end of March, both the Industrials and the Transports are <1% away from hitting new highs, which would mark another Dow Theory confirmation buy signal indicating that the market’s primary trend is still up. We’re watching closely to see if both indexes can hit fresh highs in April (we anticipate the answer will be yes, or soon thereafter).
Turning to the Dow Utilities, we follow this index because the Utilities are so closely tied to the action of interest rates and how those rates can affect the acceptable risk premium in an economy. Often times, the action of the Utilities will precede that of the broader indexes, both on the upside and on the downside. For example, in early May 2013 the Dow Utilities index headed lower for the first 2 weeks of the month, while the leading indexes (Nasdaq, S&P, NYSE, Russell) powered to fresh highs. After a 2 week bounce that was unable to carry the Utilities anywhere near prior high ground (during the same period the leading indexes continued hitting fresh bull market highs → a divergence in price action), all indexes began to falter simultaneously on 5/22/13. The downside action of the Utilities preceded the broader index action and preceded the short correction that occurred over the next month of trading. Consequently, the Utilities also had a strong bottoming day the day before the indexes hit their bottoms (6/21/13 vs 6/24/13).
Currently, the Dow Utilities are moving to fresh high ground despite the choppy downside action that leading indexes are exhibiting. This divergence is noteworthy as it could precede strong upside price progress on leading indexes in April. We’ll watch this index closely for any signs of turning lower in April, which would be a hint that the market could be primed to start the 10-15% correction that we’ve been anticipating for some time now. Based on our roadmap as updated in the very last section of this commentary, we now see this correction starting in early May 2014, so the Utilities will likely head lower before that time and find themselves unable to rally to new highs, while the leading indexes are hitting fresh highs before the big fall early next month.
In summary, the indexes look alright despite the divergences that emerged during the month. As of the end of the month, it appears the Nasdaq and the Russell are trying to mount a rally after undercutting their mid-March lows. We should be cautious not to allow the S&P or the NYSE making a new high to lure us back into the market at this point. Only a strong confirmation by the Nasdaq, the Russell, or ideally both should justify increased long exposure to the market. As of the end of March, defense is the best play going into early April.
Leading Stocks
What a difference a month makes. After strong gains in February, leading stocks were hit hard in March. After hitting peaks in late February/early March, leaders spent the better part of the month going straight down. As of the month’s end, most leaders were off by 20-25% and have flashed bigger warning signs that their upward runs may be over. This is not encouraging action for the rest of 2014, as the action of leading stocks typically precedes the action of the indexes by anywhere from 4-7 months. When the leaders fail to lead, trouble is brewing.
Momentum plays on newly public companies with limited or shoddy earnings– FEYE, ZU, SALE, TWTR to name a few– were absolutely wrecked. FEYE was off nearly 50% from its peak, and the stock for now has been tossed on the trash heap of failed leaders. To be fair, FEYE has yet to make a single dollar in its existence and its leadership was primarily price action-based. This is not to say that any or all of these stocks may not come back to be big winners in the future. The context of ‘trash heap of failed leaders’ is in relation to the next 6-9 months of market activity. I do in fact believe that advanced firewall security and intrusion protection has a long runway ahead of it, and that FEYE could potentially come back one day. The same obviously goes for TWTR, which has huge earnings expectations for 2015. In the meantime, we should sit back and watch as these stocks likely correct at least 50-70% from their IPO highs before Wall Street begins to care about them again.
With all the carnage from the month of March, there were a few stocks that seem to have survived the onslaught: FB, TSLA, PANW, GMCR, ARRS, KORS, PCLN, UA, USG, SAVE, AAL, & AMAT to name a few. As of this writing, many of these stocks have held up much better than their peers, which isn’t saying much considering everything else has been getting decimated. The ranks of leadership are thinning fast. Either we need immediate rotation (the question would be to what?) or trouble looms on the not-too-distant horizon.
As discussed last month, FB is currently our true market leading stock and TSLA is our momentum market leading stock (see prior months for a discussion of these designations). Both have top fundamentals (big earnings growth, sales growth, return on equity, strong cash flows), have products that are revolutionizing the way business is done, and are stocks to which smart institutions simply must have exposure. Both stocks are also 20-25% off their recent peaks but appear to be holding up better than their peers. For example, biotechs, solars, lesser internet content plays, and other similar plays have likely seen their best days in 2014. FB and TSLA could still have room to run and we need to watch to see if either is able to form a proper pattern that would warrant some exposure to their shares.
Of note, TSLA is expected to report a massive deceleration in earnings for the next 2 quarters (from triple digit quarter-over-quarter to flat or no growth). That does not necessarily mean the stock will fall, as earnings are expected to ramp back up in the fall, but it does give us some pause for caution. When a stock’s EPS growth rate slows dramatically for a quarter or two, it often has an adverse effect on the growth nature of the shares.
Overall, significant damage has been done and most leaders have a lot of repair work to do if they’re to regain their footing anytime soon. Since the Nasdaq and the Russell are only 4-6% off their bull market highs, it’s concerning that the best growth stocks are off at least 20%, some even more. Those stocks that seem to have held up thus far could attempt to move higher if the downside pressure comes off the market in early April (Fed minutes release on 4/9/14 by chance?). We’ll have to wait patiently and allocate accordingly to find out whether any real exposure will be warranted over the next month. Caution is again in order.
Sentiment & Psychology
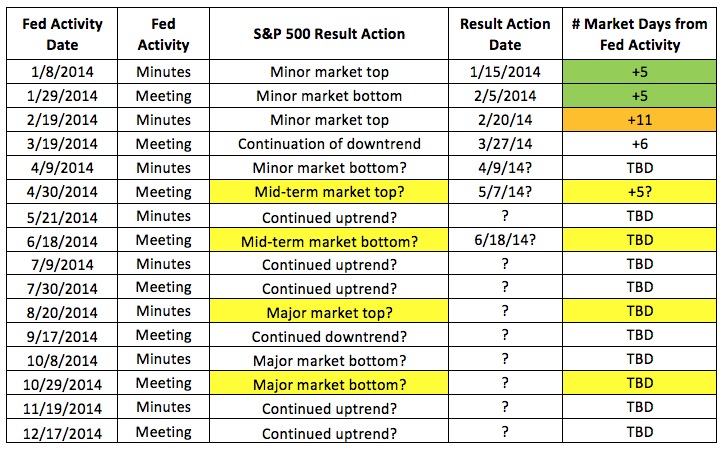
To continue the theme of this section set in prior months, I’ve updated our Fed Activity study below with new information gleaned last month: The market topped on 3/6/14, which marks a +11 from the 2/19/14 FOMC January minutes release (much longer than we’ve generally been seeing). We’ll continue tracking this throughout the year to demonstrate just how much influence the Federal Reserve has on U.S. equity markets. If you have questions on this study, please refer to our prior commentaries to understand exactly why we are analyzing this information.
Overall, measures of sentiment & psychology are secondary in nature to actual index and stock behavior. We can use these measures to help us gauge the risk/reward relationship in a given market environment, but the action of our stocks as they relate to the that of the broader indexes is the best guide to help us allocate this ratio. While our investment roadmap can also help us assess prospective return scenarios, the actual activity of indexes and leading stocks remains our primary cue.
History & Precedent
This month for History & Precedent, I was planning to discuss the bull markets that followed 50%+ market corrections (like that of October 2007 to March 2009, January 1973 to October 1974, etc.), but I’ll save the bigger bull market analysis for a future month. Instead, considering our fairly ominous roadmap for 2014, I’ll examine the action of 2 individual leading stocks in 1987 versus the action of the Nasdaq over the course of that same year, with a focus on the stocks’ action prior to the October 1987 crash.
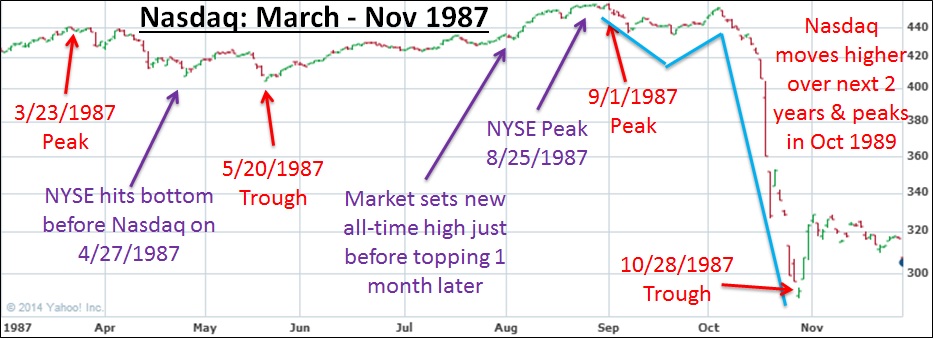
A few months back, I produced the 1987 Nasdaq chart below. Important to note are the selloff early in the year that bottomed in mid-May, the new index high set on 9/1, and lastly, the index action in October. Recognizing when indexes hit new highs is necessary to confirm the action of stocks you are following. If a stock you own isn’t hitting a new high in sync with the market, something is likely wrong with your stock. A bull market is made up of rising prices, and a stock that fails to confirm this action should be looked upon unfavorably until it changes its tune.
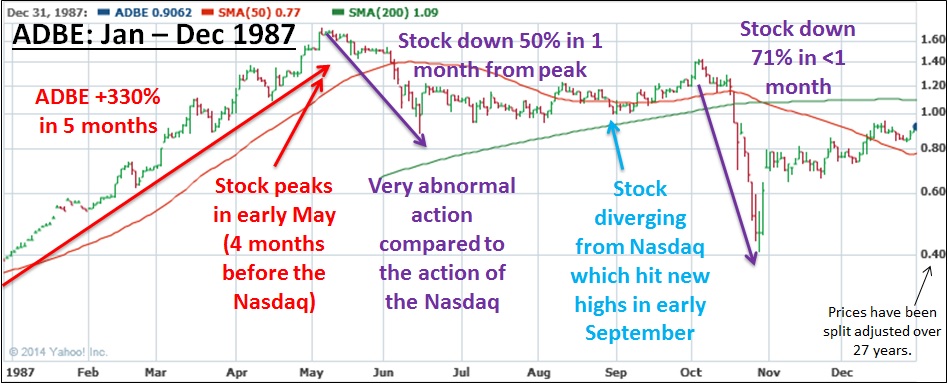
Our first leader to examine is Adobe. As you can see from the chart below, the stock went on an absolute tear in 1987, rising 330% from the top of the New Year until early May. Note that the Nasdaq’s first correction of 1987 started in March and lasted through mid-May. Adobe seemed to ignore this action, going straight up until it finally peaked in May and succumbed to selling pressure. The stock then fell 50% from peak to trough over the next month, which was quite excessive in the context of the Nasdaq’s 8.0% correction. ADBE then attempted to rise, but couldn’t make it back anywhere near its prior price high. By September 1st when the Nasdaq was hitting its peak, ADBE was still well off its highs, demonstrating that its leadership status had expired and something was astray. You’ll note that the stock topped a full 4 months before the Nasdaq hit its peak.
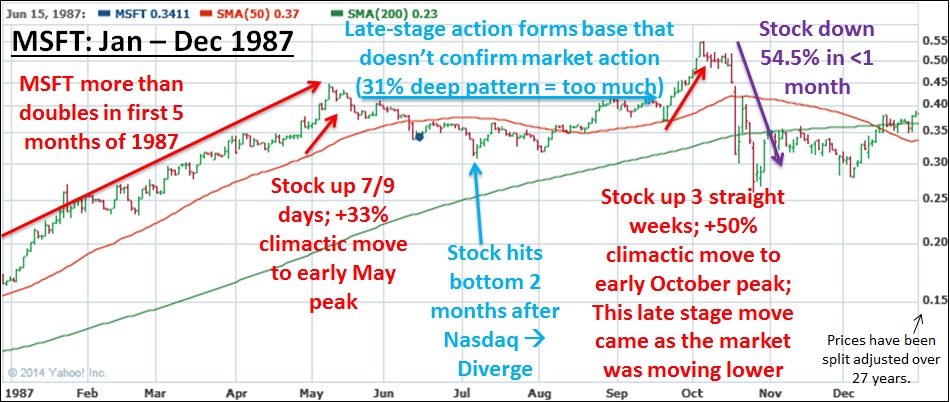
The second stock is another with which you should be familiar. Microsoft came public in Q1 1986, and subsequently ran 360% over an 8-month time period from October 1986, even doubling in the first 5 months of 1987. The stock then flashed a classic sell signal, a sharp acceleration in price increase (+33% in 9 days) which arguably marked the end of its investable move. Similar to Adobe above, MSFT ignored the Nasdaq’s early correction and charged higher into May, before then diverging until the last possible second before the October carnage started. The 31% deep pattern was again excessive in context of the Nasdaq’s modest 10% correction, and the non-confirming nature of the selloff demonstrated weakness. As with ADBE, MSFT topped a full 4 months before the Nasdaq hit its 1987 peak. The leaders certainly led the market in 1987, and they surely will again in 2014.
In conclusion, we wanted to share these precedents to demonstrate that history does indeed rhyme in funny ways. Please remember that History & Precedent analysis is secondary in nature to us and we do not make investment decisions based upon the work we do here. We merely utilize this information to help us gauge likely risk/reward ratios in a given market environment. Since Wall Street is essentially human psychology on display, there are common themes that repeat themselves cycle after cycle. By celebrating the lessons of the past, we hope to avoid becoming ensnared in similar future situations. This rings especially true for our current predicament, in which leaders are flashing climactic activity possibly 4 to 7 months before a bigger market rout.
Investment Roadmap
In February 2014 we outlined our roadmap for the market over the next 6 years. We understand this is a bit bold if not extremely unconventional in the asset management industry, but regular readers of this commentary should understand our philosophy of why it’s helpful to construct a forward-looking projection of capital market behavior. As the mantra goes: History doesn’t exactly repeat itself, but it often rhymes, and those who forget history are doomed to repeat it. We plan to continually update the roadmap with new information as the market presents it to us. By no means do we expect markets to play out exactly as we’ve outlined—rather, this type of analysis simply helps us understand where and when the best risk/reward ratios are. Here’s our roadmap with a few updates from last month:
1. The key indexes (Nasdaq, S&P500) hit selloff lows on 2/5/14.
2. From that point, the indexes rallied to new bull market high ground, reaching peaks in the first week of March 2014 (3/4-3/7).
3. The market has been in a downtrend since that time, and we expect it to culminate about the time of the March minutes release on April 9th.
4. We’re then looking for the market to rise sharply from 4/9/14 through the April FOMC meeting on April 30th. The likeliest scenario is that the market hits its peak for the move in the first few days of May.
5. From early May, the market will sell off for slightly more than a month through early June, making prescient the old adage “Sell in May and go away”. We’re looking for a bottom in the first 10 trading days of June.
6. The market will rise again to new high ground over the following 2.5 to 3 months until the July 2014 FOMC meeting minutes release (8/20/14 +5 days), at which time a major market top will be set.
7. A major market selloff (20-30%) will start in mid-to-late August and continue through late October 2014.
8. The market will hit bottom in late October 2014 and then enjoy a strong end-of-year rally. November and December should be excellent months to be invested on the long side of the market.
9. The strength exhibited should continue through 2015. No year that ends with a ‘5’ in the history of the stock market has been a bad year (yet). We think this trend will continue for now, despite a minor setback or two during the year (see the minor zigzags we’re forecasting in the middle of the year– we assure you they have meaning, but for now you can just take our word for it).
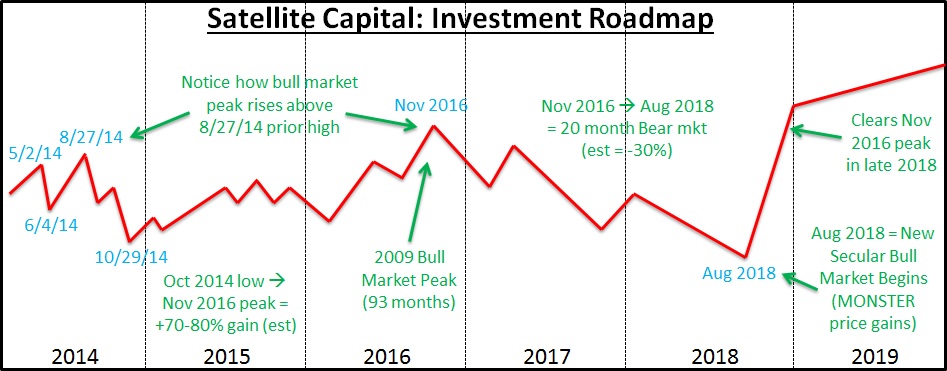
10. The market will continue higher into 2016, with the occasional hiccup. A major bull market top will be set in November 2016, ending the bull market that started in March 2009.
11. We are currently modeling a 30-35%, 20-month-long bear market from November 2016 through August 2018.
12. A new secular bull market will begin in August 2018, with each index marking all-time high ground by the end of the year (this includes seeing the Nasdaq climb above the 5132 peak set in March 2000). From there, strong gains can be expected into early 2020.
The above will be constantly tweaked as new information presents itself. Our roadmap helps us apex the market’s major turns by keeping the larger design of the market’s racetrack in mind. This larger framework is what’s important, because it’s a factor in how much risk we are willing to undertake at a given time. We remain ready and willing to change any or all of our conclusions from the above analysis as more market information presents itself. A huge component of our risk management activity is being extremely rigid with our investing rules, and very flexible with our expectations. Our job is not to predict, but to interpret. We interpret current market action and adjust our positions accordingly. We do not condone an investor using this roadmap as anything more than educational input, as we could change our positioning on a dime (and will if the market tells us we need to).
Conclusion
In summary, March’s action seemed indicative of equity markets’ likely path later this year. The night and day difference between index action and that of leading stocks foreshadows the most plausible broader market action to come in 2014. While many of the best growth stocks have likely already nocthed their highest levels for this bull move, a few leaders have managed to hold up well thus far and could go on to form constructive price consolidations before moving higher in the coming months.
Something to look forward to in April (for us at least) is the next FOMC meeting scheduled for Wednesday, April 30th, at which an additional $10B per month of tapering is expected to be announced. But we’ll need to first note the market’s reaction to the March minutes release on Wednesday, April 9th. After seeing March’s market action, we now anticipate the market will hit a low within the first 10 trading days of April before rising strongly for about 3 weeks to close out the month. The big question is whether the Nasdaq and the Russell 2000 will be able to surpass their early March highs, which are critical to the underpinnings of our Investment Roadmap over the next 1-2 months.
Regardless of what the market does, our primary objective at Satellite Capital is always the preservation of our partners’ capital. Generating a steadily rising equity curve is of secondary importance to protecting the assets we‘ve already been entrusted to manage. We’ll be back in early May with our commentary on April’s action, which should be another exciting chapter as we approach the intermediate-term market top. Have a great month!