February 3rd marked the first day of Janet Yellen’s reign as new Chair of the Fed (she prefers the gender neutral title in case you were wondering). Yellen’s key market-moving activity for February included speaking on Capitol Hill twice: once to the House Financial Services Committee, and once to the Senate Banking Committee. In both her appearances, she indicated that the Fed is closely monitoring the weather’s level of responsibility for the mixed bag of economic data that has been printing since the year’s start. If the weather is responsible for the softening in the data, then the Fed has little reason to stop the $10B per month tapering of its asset purchases. If the economy is indeed weakening, a pause in the taper may be warranted (the Fed is currently buying $65B per month of bonds, down from $85B per month at the December FOMC meeting). We’ll find out what the FOMC decides when it meets on Wednesday, March 19th.
Speaking of economic data, readings from February painted a cloudy picture. Whether it was due to the unusually powerful winter weather, or to actual softening in the economy, only time will clarify. If the weather is the culprit, the numbers should bounce back as the nation begins to thaw out over the coming weeks and months. With partial sarcasm, quite possibly the most alarming economic news from February was that the famous groundhog from Punxsutawney, PA saw his shadow, forecasting 6 more weeks of winter. If the groundhog proves right, the Fed could continue to have a tough time detecting what’s actually happening with the economy.
Moving onto the numbers, January non-farm payrolls came in at +113K versus expectations for +190K, December payrolls were revised higher to +75K from +74K at first report, November payrolls were revised higher from +241K to +274K, the official government reported unemployment rate (U3 in econ geek speak) fell to 6.6% from 6.7% in December, and the labor force participation rate climbed off its lowest level since 1978 by hitting 63.0%. The second reading for Q4 GDP growth came in at +2.4% versus the initial reading of +3.2%, as consumer spending, imports and exports all provided a smaller boost than initially measured.
Leading stocks had a banner month in February. For the top 35 stocks we have on our ‘Target List’, the average return for the month was about +18%, and the overwhelming majority of these leading stocks moved strongly into fresh high ground. Despite a blip on the final day of the month where reports of Putin invading the Ukraine likely spooked the market (the average leader plunged 4% over a 30-minute stretch), leaders managed to rebound higher into the close and cap off their strong month of gains on a positive note. All current indications are that this trend will continue into late March, at which time an intermediate market correction will commence. Unless you have 40-60% gains on any positions you’ve initiated over the past 3-5 months, taking profits towards the end of March and waiting for the dust to settle after the ensuing correction is likely to be the highest probability play. We’ll touch more on this in our analysis below.
This month, as we have every month since August 2012, we’ll break our market analysis down into our 4 pillars of market health: 1) The action of the indexes, 2) The action of the best leading stocks, 3) Sentiment & Psychology-based indicators, and 4) Historical precedent action. Remember that Thomas and I place the most weight on pillars 1 and 2 (our primary measures of market health) when performing our analysis. Pillars 3 and 4 are important, but are secondary indicators in nature and need to be treated as such.
I’m going to dive right into analysis under the assumption that readers of this commentary have read our previous installments and have developed a basic understanding of our approach to the market. For first time readers, I recommend reviewing our February 2013 Commentary and earlier to ascertain a detailed explanation of why we at Satellite Capital examine what we do, and why we are interested in certain stocks over others. And as always, please don’t hesitate to contact Thomas or I with any questions.
Indexes
For the month of February, the Nasdaq bolted 4.98%, the S&P 500 climbed 4.31%, and the NYSE Composite rose 4.60%. After selling off early in the first few days of February, each index regained all of the ground it had lost in the mid-January to early February selloff and entered new bull market high ground by months end. This action is compelling and jives with our projection that we’ll also see strong gains into late March (estimating 3/26/14 as a potential topping day).
To introduce a new element to this section, I’m now going to briefly comment on the action of U.S. Treasuries. The various types of analysis that Thomas and I employ transcend the equity indexes, as we’re always trying to develop a deeper understanding of the broader macro investment picture (equities, bonds, commodities, currencies, etc). Of interesting note is that the 10 and 30-year interest rate charts have very pronounced head-and-shoulders topping patterns dating back to April 2013.
Both rate charts also brandish rapidly approaching ‘death crosses’, an ominous technical indicator in which the 50-day moving average crosses below the 200-day moving average. This is a particularly negative signal and it’s very close to manifesting on both rate charts. We’re currently projecting that the 30-year U.S. Treasury bond could fall to a low yield of 2.0-2.1% by Q4 2014. We’ll detail how we came to this figure at a later date due to space and time constraints, but the potential impact of this on the economy could be major: Deflation? Global unrest? Time will tell, but we’ll be watching this very closely.
In summary, the indexes had a markedly better month in February than in January, and were able to turn 2014 yearly losses into gains. We advised last month that it was wise to seek long exposure, and those investors who heeded our advice were rewarded handsomely. We see more of the same in March, but urge caution in late March as the indexes traverse the 3/19/14 FOMC meeting. The first reaction after an FOMC meeting is usually the wrong reaction, and we’re looking for strong topping action to occur later this month. Remember to always moderate the risk you are willing to assume on any position, and cut your losses short when you have them.
Leading Stocks
February was a monster month for the best stocks in the market. A sampling of what we feel are the best stocks at the moment includes (in alphabetical order): ACT, CSIQ, FB, FEYE, GMCR, KORS, LVS, NFLX, PANW, PCLN, QIHU, SCTY, TSLA, UA, VRX, & ZU. Within this pack, we’d consider Facebook (FB) the true market leading stock that institutions simply must own (Apple held this role until Q1 2012), and Tesla (TSLA) the momentum leading stock. Seeking significant exposure in both these leader categories should be the top priority for an investor on the long side of the market. Then, once positions are established from proper entry points, handling those positions and holding those winners as long as possible becomes the next challenge.
Both FB and TSLA exhibit top fundamentals (big earnings growth, sales growth, return on equity, strong cash flows), have products that are revolutionizing the way business is done, and are stocks to which smart institutions simply must have exposure. While these 2 stocks are currently head and shoulders above the rest (no pun intended) and therefore merit a larger relative amount of portfolio exposure, there are still other stocks making incredible gains right now that can be held in tandem with our 2 primary leaders.
Zulily (ZU), hailing from the internet retail flash sale and discount segment, roared on the scene by breaking out of an early stage pattern in the last week of February. The November IPO had been consolidating since December, after jumping more than 100% from its initial offering price of $22 per share. You may recall that we closely analyze the trading volume of stocks in which we’re interested. The higher the volume on the upside price move, the higher the probability that an upward trend is likely to continue. This is because institutional investors are often scrambling to try to get into a stock, thereby pushing the price drastically higher, and often in volume that is well above the normal range. Zulily was no exception, as the stock roared ahead 36.3% on February 25th in volume that was 1,248% above average. The stock closed the last week of February up an astounding 68.0%.
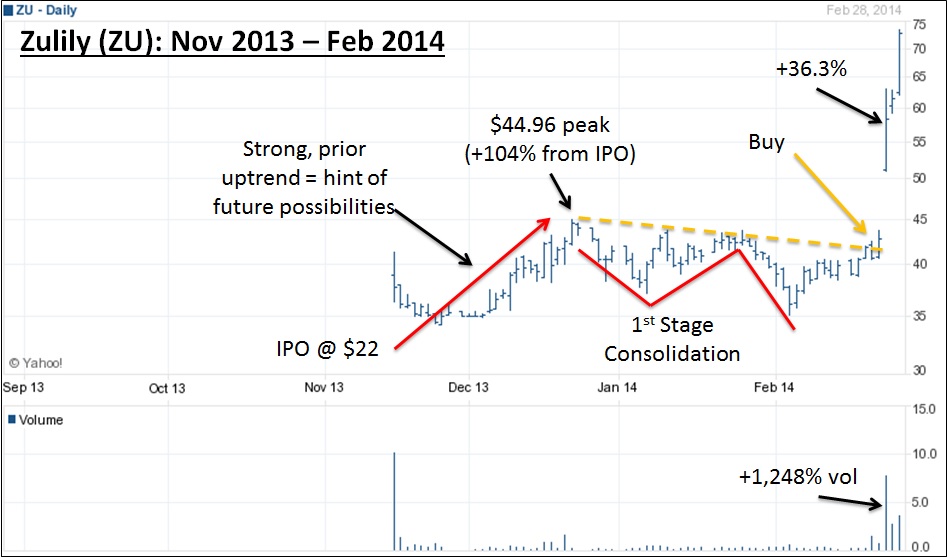
Given that ZU broke out of a first-stage chart pattern and rose >20% in 3 weeks or less, those savvy investors who correctly bought the stock should be holding it for AT LEAST 8 weeks. Aligned with our roadmap, this means that an investor would hold the stock into what we perceive will be a late-March to late-April 2014 correction (more on that below in the History & Precedent section). The purpose of the 8-week hold rule is to give big winners a chance to run, and it also helps an investor make it through the inevitable pullback that can be volatile and difficult to weather. If you missed this stock (as many did), revisit it at the end of April if the stormcloud over the market has cleared by then. The volume character of ZU’s breakout suggests strong upside potential for this stock into the eventual major market peak in Q3 this year.
The update we made last month to our investment roadmap proved prescient. Recall that we were previously looking for an intermediate-term market peak near the release of the January Fed minutes on (2/19/14). Given the negative action towards January’s end, we saw that we hadn’t accounted for the January-February selloff that was capping the month (we previously thought the December 2013 selloff aligned with the August 2013 selloff, but we determined last month it did not). If I just lost you (more than likely), stay with me. The August 2013 correction now aligns perfectly with the correction we just saw from 1/22/14 to 2/5/14. We used the information we gleaned in late January and early February to conclude we were about a month premature in our estimate of when the indexes are set for an intermediate correction, which we’ve now slated to start around 3/26/14.
What this means for leading stocks is that the best leaders should continue to make significant progress higher into late March. The characteristics of the move could even be quite frothy, as these stocks explode higher in the absence of any significant catalysts (earnings season is over for most stocks). March looks to be a particularly exciting month to be invested in the market. Those who are properly positioned should make significant portfolio progress during the month. However, investors should be extremely careful as the month advances. Around the time of the Fed meeting on 3/19/14, volatility is likely to increase. Keep in mind that the first market reaction after a Fed meeting is usually a head fake in the wrong direction. If the market gets a boost from the result of the Fed meeting and Janet Yellen’s first press conference, we can be confident that the downside scenario will play out in April.
Overall, almost all leaders that we follow are well extended from proper buy areas as of this writing. Given that we are already in the middle of an existing trend, strict risk management dictates that we need to be careful about buying stocks at these levels. The pressure came off the proverbial basketball being held underwater last month (i.e. the downside pressure holding the best stocks down), and the market exploded higher as soon as the weight was removed (see January’s commentary conclusion for why we use this analogy). As most leaders have just broken out of consolidation patterns and have moved to highs, further gains into March should be expected.
While we remain committed to the long side of the market, we’re critiquing each day’s market action versus that of leading stocks to determine the right time to exit our positions. If the indexes’ drop indeed commences in late March at the Fed meeting, we assure you we’ll cut our long holdings and position ourselves on the short side of the market, at least for a brief period of time. Until that time, risk management remains our primary focus, and cutting losses quickly while letting winners run is key to unlocking strong returns.
Sentiment & Psychology
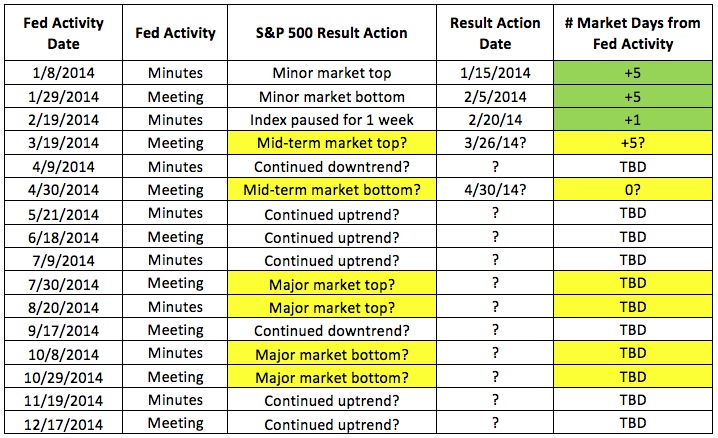
To continue the theme of this section set in prior months, I’ve updated our Fed Activity study below with new information gleaned last month: The market bottomed on 2/5/14, which marks a +5 from the 1/29/14 FOMC statement. We’ll continue tracking this throughout the year to demonstrate just how much influence the Federal Reserve has on U.S. equity markets. If you have questions on this study, please refer to our prior commentaries to understand exactly why we are analyzing this information.
One final item to note in this section is the NYSE Advance-Decline line, which compares the net of advancing stocks less declining stocks. This indicator is a measure of breadth in the market, and helps us to see if a disproportionate number of stocks are acting stronger than the rest. As of the end of February, both the NYSE and Nasdaq A/D lines had moved into new high ground, a confirmation of both indexes’ price action (both have reached new highs). We like to see price action and A/D action move together and confirm one another. A divergence between these 2 would be a powerful signal that something has gone awry, and that we should scan closely for a potential change in trend.
Overall, measures of sentiment & psychology are secondary in nature to actual index and stock behavior. We can use these measures to help us gauge the risk/reward relationship in a given market environment, but the action of our stocks as they relate to the that of the broader indexes is the best guide to help us allocate this ratio. While our investment roadmap can also help us assess prospective return scenarios, the actual activity of indexes and leading stocks remains our primary cue.
History & Precedent
This month we’ll examine a precedent period just 4 short years ago that our current market is mirroring closely. Oddly enough, even the dates from Q1 2014 line up fairly well with what was experienced in Q1 2010. Please remember that like Sentiment & Psychology, all History & Precedent analysis is secondary in nature and that we take our primary cues from the action of indexes and leading stocks. This analysis can help us better understand the environment within which we are investing, and help us gauge how much risk we may or may not be wise to take in a given situation.
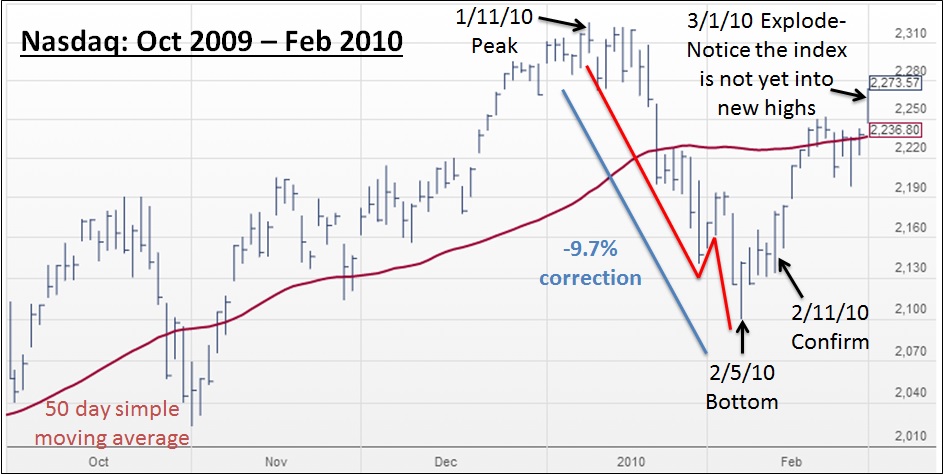
Our first chart below shows the Nasdaq from 10/1/2009 through 3/1/2010. The index started to get choppy starting in early January near its eventual January 11th peak, and then suffered a 3-week correction that took the index 9.5% lower. You’ll see 3 zigzag red lines on the chart that mark an A-B-C selloff, which is characteristic of Elliott Wave Down 4 action (see prior commentaries for discussion of Elliott Waves). On 2/5/10, the index sold off to a new intraday low before rallying higher into the close, marking the bottom of the selloff. 4 days later on 2/11/10, the index rose sharply in higher volume than the previous day (volume not pictured) and fashioned what we call a confirmation or follow-through day, confirming the nascent uptrend.
The Nasdaq then climbed higher through 2/22/10 and began trading sideways at the index’s rising 50-day moving average line (pictured in red). Lastly, not marked on the chart but fairly evident if you look at the 5 trading sessions prior to 3/1/10 (2/22/10 through 2/26/10), you’ll see the index drifted lower before finally exploding higher. This is a powerful pattern, serving to shake out the last weak stockholders before the index can finally jump higher. We monitor for similar action on individual stocks before they spike to new highs. We call this period of drifting downward ‘handling’, and it’s extremely important as a risk management policy to help determine proper entry points.
Keeping in mind everything mentioned regarding the 2010 chart above, let’s now turn our attention to the 2014 chart below. As you can see, the same structure presents itself: a mid-January peak, a 2/5 bottom, and a 2/11 confirmation day. We’re now awaiting either a 3/3 or 3/4 ‘explosion’ day, and must admit we find it amusing that the corresponding bottom and confirmation days happened 4 years later to the day. The 2014 correction was not nearly as deep at only 6.5%, yet had the same underlying A-B-C Elliott Wave Down 4 structure (meaning we’re now in Up 5, the final leg of a 5-wave cycle which should be followed by a larger magnitude Down 4 with A-B-C structure starting in late March).
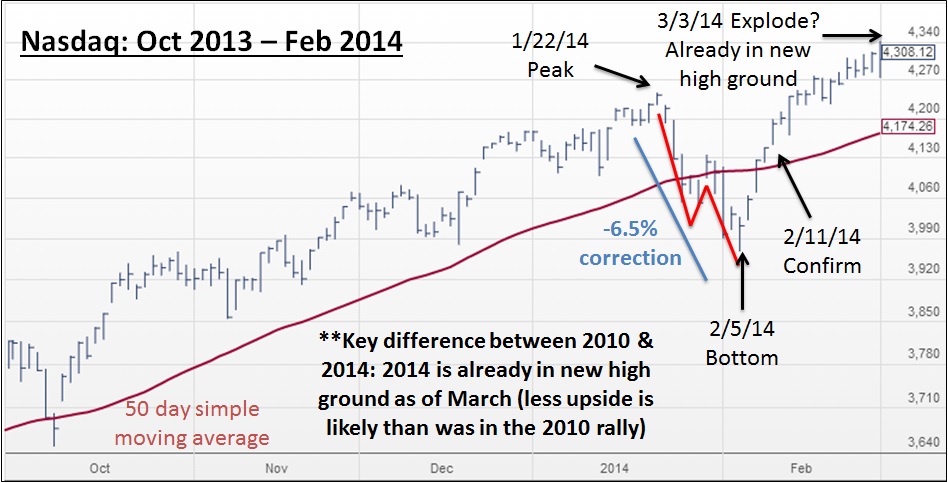
Lastly, the most important item of note when comparing these 2 periods is that the 2014 Nasdaq is already well into new high ground, while the 2010 Nasdaq was not as of 3/1/10. We feel there are a few reasons for this, but essentially it indicates to us that we have a much more limited upside than the index had in 2010. Given certain measures we use, we estimate that the Nasdaq could rise to around 4450 for this particular wave pattern, meaning a 3.3% increase from February’s closing price of 4308.
One could extrapolate this analysis further to consider what may transpire at the 3/19/2014 FOMC meeting. Despite widespread expectations that the Fed would start tapering at its September 2013 meeting, the market rose from the end of August 2013 through the actual meeting, at which time the Fed revealed it wasn’t yet ready to start tapering its bond purchases of $85B per month. The market rose in anticipation of the ‘good’ news of postponing the taper, but sold off after the news was made official. The key here was reading what the market itself was doing, and not what economic pundits in the news were saying. The market knew better, and had already priced in the news before it was announced.
Now in March 2014, we’re expecting the market to rise through the 3/19 Fed meeting, as demonstrated above and pictured in the Investment Roadmap section below. To this, we’re estimating the Fed won’t taper any additional amounts at its March 2014 meeting, but will instead keep buying $65B of bonds monthly until it can determine if the weather is the drag on the economy, or if there’s a larger underlying problem that hasn’t yet been addressed. Once the good news is disclosed in late March, we’re looking for an intermediate-term top signaling the start of a 1-month correction on all of the indexes. In any event, the current market action appears to dictate that it’s expecting something good to happen later this month.
In conclusion, we wanted to present this precedent period to demonstrate that history does indeed rhyme in funny ways. Next month we’ll share some research we’ve been doing about bull markets following 50%+ corrections (like we experienced from October 2007 to March 2009). More on this in the Conclusion section below. Please remember that History & Precedent analysis is secondary in nature to us and we do not make investment decisions based upon the work we do here. We merely utilize this information to help us gauge likely risk/reward ratios in a given market environment.
Investment Roadmap
Last month, we outlined our roadmap for the market over the next 6 years. We understand this is a bit bold if not extremely unconventional in the asset management industry, but regular readers of this commentary should understand our philosophy. As the mantra goes: History doesn’t exactly repeat itself, but it often rhymes, and those who forget history are doomed to repeat it. If Wall Street practitioners are the heroes of what is considered to be the ‘right’ way of investing in the market, then we’ll happily embrace the role of the villain. Here’s our roadmap with a few updates from last month:
1. The key indexes (Nasdaq, S&P500) hit selloff lows on 2/5/14.
2. From that point, the indexes will rally to new bull market high ground through the March FOMC Meeting (3/19/14). We feel there is strong likelihood that the actual top will be up to 5 days after the Fed meeting (see Fed Activity study above), which could mark 3/26/14 as the key topping date.
3. The market will then sell off for roughly 1 month to the April FOMC meeting (4/30/14).
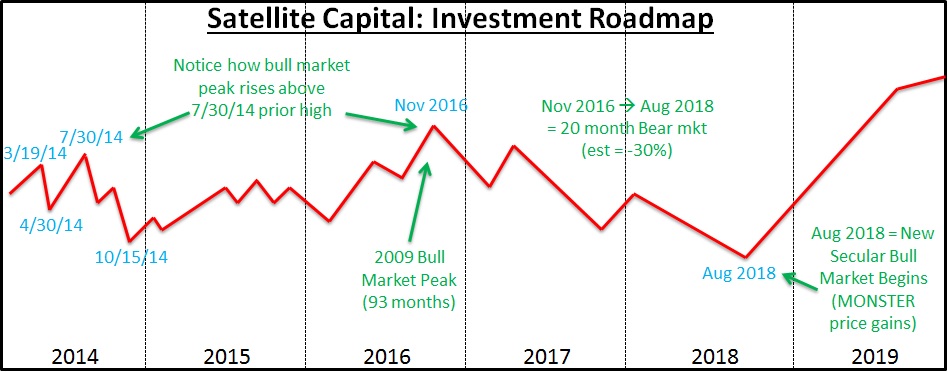
4. The market will rise again to new high ground over the following 3 months until the July 2014 FOMC meeting (7/30/14), at which time a major market top will be set.
5. A major market selloff (20-30%) will start in August and continue through October 2014.
6. The market will hit bottom in early October 2014 and then enjoy a strong end-of-year rally. November and December should be excellent months to be invested on the long side of the market.
7. The strength exhibited should continue through 2015. No year that ends with a ‘5’ in the history of the stock market has been a bad year (yet). We think this trend will continue for now, despite a minor setback or two during the year (see the minor zigzags we’re forecasting in the middle of the year– we assure you they have meaning, but for now you can just take our word for it).
8. The market will continue higher into 2016, with the occasional hiccup. A major bull market top will be set in November 2016, ending the bull market that started in March 2009.
9. We are currently modeling a 30-35%, 20-month-long bear market from November 2016 through August 2018.
10. A new secular bull market will begin in August 2018, with each index marking all-time high ground by the end of the year (this includes seeing the Nasdaq climb above the 5132 peak set in March 2000). From there, strong gains can be expected into early 2020.
The above will be constantly tweaked as new information presents itself. Last month we opined that the highest probability play was to seek heavy market exposure in both February and March. Half of that scenario has played out thus far, giving us reason to believe that we’re right until the market dictates to us otherwise. Our roadmap helps us apex the market’s major turns by keeping the larger design of the market’s racetrack in mind. This larger framework is what’s important, because it’s a factor in how much risk we are willing to undertake at a given time. Our risk tolerance in this environment continues to be high, as we are heavily exposed to the long side of the market.
Lastly, a short disclaimer: We remain ready and willing to change any or all of our conclusions from the above analysis as more market information presents itself. A huge component of our risk management activity is being extremely rigid with our investing rules, and very flexible with our expectations. Our job is not to predict, but to interpret. We interpret current market action and adjust our positions accordingly. We do not condone an investor using this roadmap as anything more than educational input, as we could change our positioning on a dime (and will if the market tells us we need to).
Conclusion
In summary, February was a positive month for stock investors, sparking a trend we’re expecting to continue well into March. Leading stocks generated monster gains while the best indexes all powered to fresh bull market highs. ‘Letting the trend be your friend’ is the best course of action going into March. As the month progresses, taking profits and capitalizing on the gains generated from February and the first half of March will be key to capital preservation. Our first and foremost objective at Satellite Capital is preservation of our partners’ capital. We can only focus on generating a steadily rising equity curve after we’ve first ensured protection for the assets we’ve been entrusted to manage.
Next month, we’ll examine some bull markets that followed market corrections of more than 50% (like we just experienced in 2007-2009). Analyzing similar periods of history that also saw this type of correction helps us develop a feel for how long and how swiftly these bull markets moved. Our current roadmap models a 93-month bull market (March 2009 to November 2016), which would be about the average length of the bull markets we’ll explore next month. We’ll also present a few index charts with some trend line analysis that has proved interesting, and should be especially timely in early April.
We’ll be back in early April with our commentary on March’s action. Please don’t hesitate to reach out to Thomas or myself with questions about anything we’ve discussed. Have a great month!